Important Cash Flow Metrics For Small Businesses
We were always focused on our profit and loss statement. But cash flow was not a regularly discussed topic. It was as if we were driving along, watching only the speedometer, when in fact, we were running out of gas.
- Michael Dell, founder, and CEO, of Dell Technologies.
Michael Dell began his business operations from his dorm room, eliminating the retail overhead costs to stay ahead of his competitors' curve. Usually, the retail business model yields lower profit margins for more small players. Also, he focused on the profit and loss statements to assess his business performance. However, he had to realize that cash flow is the lifeline of his business.
Similarly, being a small business owner, you might run the business operations from your garage as Dell did. It may help you avoid overhead costs when you operate on limited cash. But it would be best if you did not neglect cash flow statements like Michael Dell.
For instance, what would happen if you were driving a car, keeping an eye on the speedometer, and not paying attention to the fuel? You would eventually run out of gas and get stranded. Cash flow is like gas for business; gambling with it is not wise for your business.
To keep a steady grip on cash flow, you must understand the basics of cash flow and how to manage it. Along with them, knowing the cash flow metrics enables one to understand business performance using cash flow statements deeply.
This article discusses ten important cash flow metrics you can use to improve the cash flow.
Contents
What are Cash Flow Metrics Exactly?
1. Cash Flow From Operations
2. Working Capital
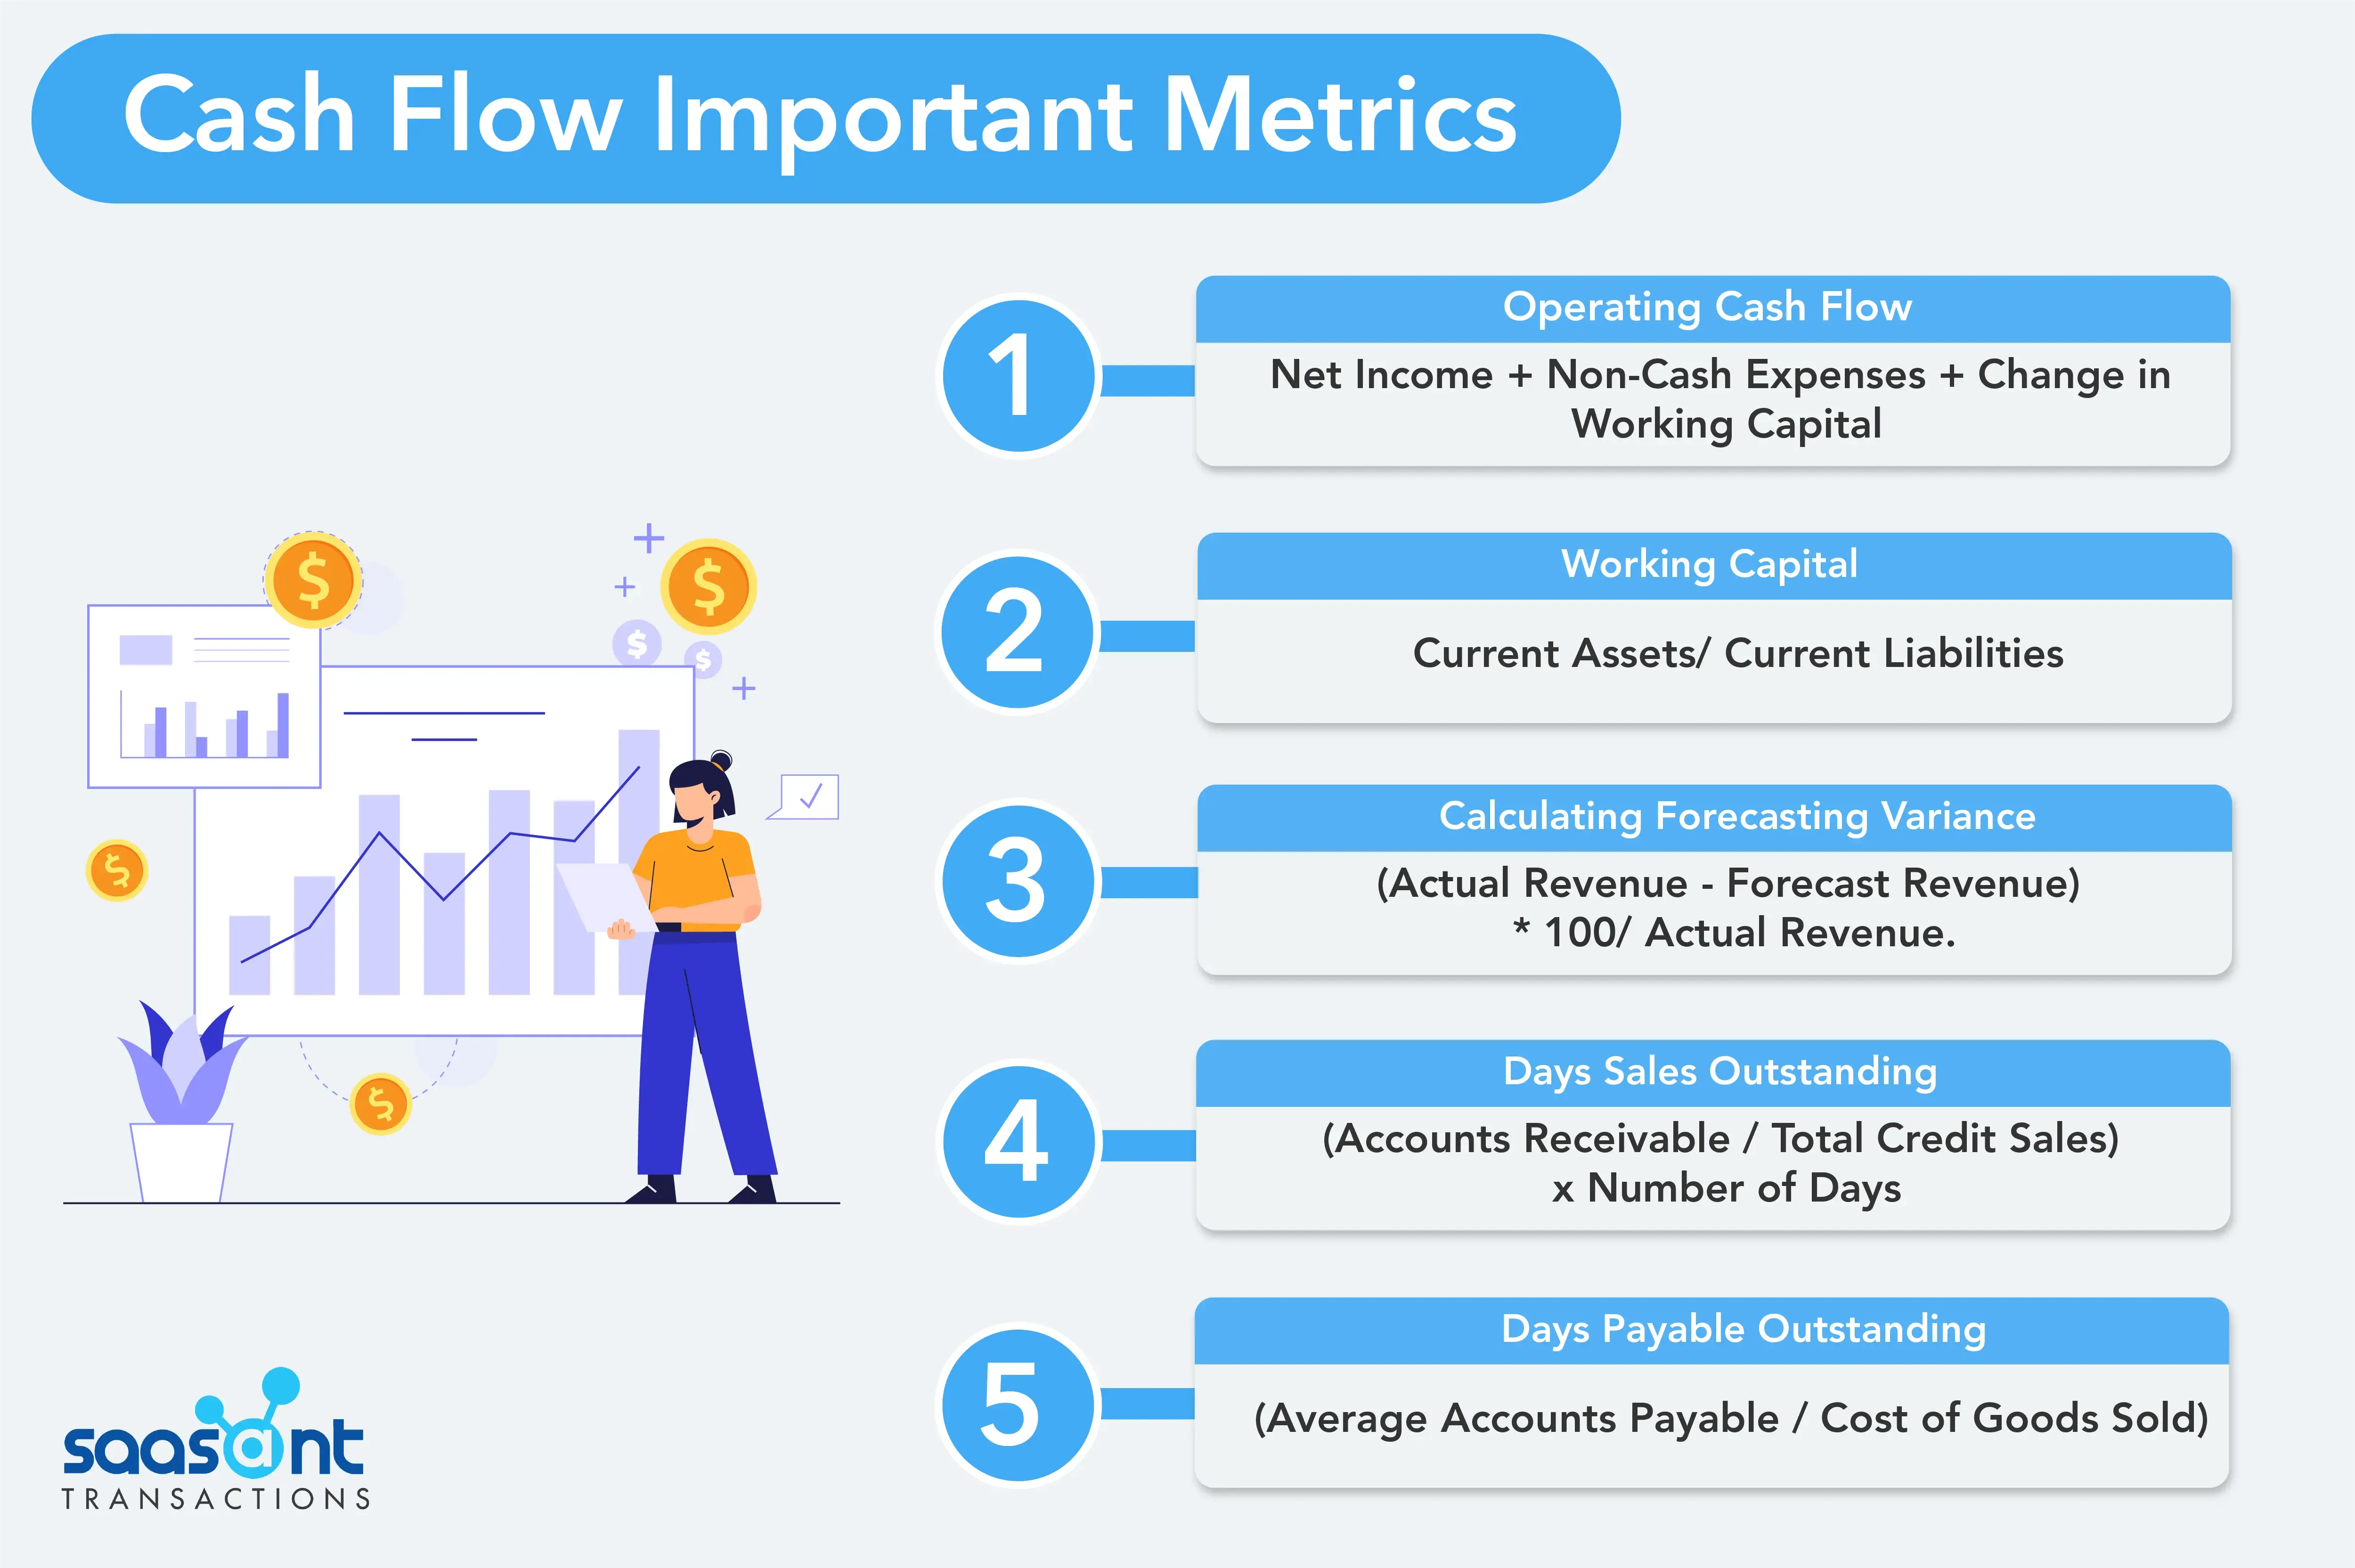
3. Forecast Variance
4. Days Sales Outstanding
5. Days Payable Outstanding
6. Accounts Receivable Turnover
7. Accounts Payable Turnover
8. Current Ratio
9. Free Cash Flow
10. Cash Flow Coverage Ratio
What are Cash Flow Metrics Exactly?
According to Investopedia, the definition of metrics is "A quantitative assessment commonly used for comparing and tracking performance or production."
When you run a business and look at cash flow statements, you need to know more than the basics of cash flow. Well, understanding and analyzing them makes you comfortable when you look at them without fidgeting your legs. But, it’s necessary to get accustomed to interpreting the cash flow statements, churn the metrics they offer, and use the details to create well-structured business plans. Cash flow metrics are quantifiable measurements using a cash flow statement. Having business performance data lets you make informed decisions about your business.
Some of the important cash flow metrics are listed below..

1. Cash Flow From Operations
Running business operations involves cash outflows and inflows, such as employee salary, payment of vendors and suppliers, and tax paid, and you receive payment for products you sell or the services you provide. In a QuickBooks cash flow statement, you usually find operating activities cash flow listed first. It doesn't include income from investment and interest. Maintaining proper operating cash flow helps you to operate your business without an additional loan or outside investment.
Operating Cash Flow = Net Income + Non-Cash Expenses + Change in Working Capital |
Usually, QuickBooks calculates the net income using the profit and loss statement ( income statement ) for cash flow calculation.
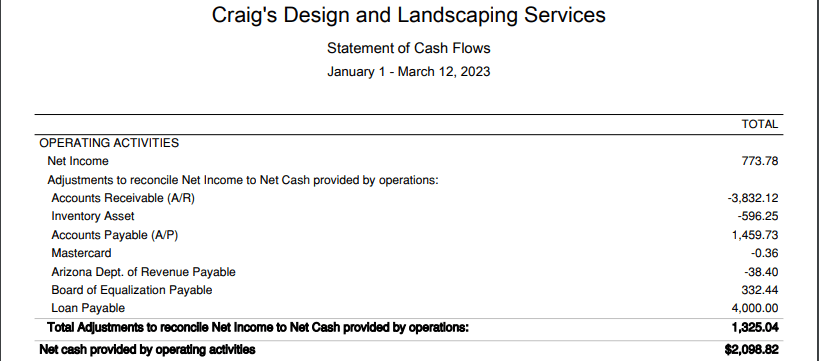
Look at this example,

The net income of $773.78 is calculated from the above example's Jan - March income statement.
Net Income: $773.78
Accounts Receivables: $-3832.12
Inventory Asset: $-596
Accounts Payable: $1459.73
Master Card: $-0.36
Arizona Dept. of Revenue Payable: $-38.40
Board of Equalization Payable: $332.44
Loan Payable: $4000
Operating Cash Flow = - 3832.12 -596+1459.73-0.36-38.40+332.44+4000
After adjusting the net income provided by operations, you get $1325.04.
Operational Cash Flow = 773.78 + 1325.04
=2098.82
It means the operating cash flow is positive. It's sufficient to run the business without extra funds.
2. Working Capital
This metric calculates the ratio between a company's current assets and liabilities. Thus, indicating how quickly a business can generate cash for your business.
Simply put, your current assets are accounts receivable, cash, inventory assets, and other quick cash convertible assets.
Your current liabilities are accounts payable, short loans, and other liabilities you expect to pay on short notice, maybe a year.
Working Capital = Current Assets/ Current Liabilities |
Your working capital ratio should always be greater than 1, indicating that you can pay for current liabilities.
Let us assume:
Accounts Receivables: $3000
Liquid Cash: $500
Inventory Asset: $500
Accounts Payable: $800
Short-Term Loans: $3000
Working Capital = 3000+500+500/3000+800 = 1.052
Here, the working capital ratio is greater than 1. It means the business can pay the current liabilities.
3. Forecast Variance
"Where we're going, we don't need roads" - Dr. Emmett Brown, Back to the Future.
But for your business, you need a road. It's where a Ferrari named forecast variance takes the road of probability and chances.
Forecast variance is the difference between forecasted revenue and actual revenue.
It allows you to foresee the revenue and focus on the trends and patterns in the market setting. With that, you can make decisions on inventory purchases, hiring employees, and planning the spending on marketing with the help of forecast variance.
Calculating Forecasting Variance = (Actual Revenue - Forecast revenue) * 100/ Actual Revenue. |
For example, during the Halloween season, a candy store owner needs to be diligent with the forecasting variance as there will be a massive spike in sales.
Let’s assume he forecasts revenue of $1500 from sales, and the actual revenue is $2000 as it is Halloween season.
CFV= (2000-1800)x100/1800
= 10%
4. Days Sales Outstanding
It is a financial metric that denotes the average number of days a business takes to collect money from its customers following a product sale.
Simply put, it measures the time a business takes to receive payment for sold goods or services.
DSO is an essential indicator for small business owners since it can affect cash flow and financial health.
A high DSO indicates that customers are slow to pay, which can strain a company's cash flow and demand more funding to meet costs.
A low DSO means customers make payments quickly for the company's products or services.
DSO= (Accounts Receivable / Total Credit Sales) x Number of Days |
Accounts Receivable is the amount of money owed by customers to the firm. Total Credit Sales are the total sales amount made on credit over a particular time. The Number of Days is usually a month or quarter.
For instance, if a small business has $1000 in accounts receivable and $4000 in total credit sales for the month of January, and there are 31 days in January, the DSO would be as follows:
DSO = ($1000 / $4000) x 31 = 7.5 days
This indicates that it takes the business an average of 7.5 days to receive payment from clients after extending credit.
By frequently monitoring DSO, small business owners may discover trends and take action to enhance cash flow and financial performance. Owners can offer incentives for early payment, follow strict credit policies, and automate the invoicing and payment process to prevent and reduce errors and delay in the payment process.
Speaking of automation, tools SaasAnt Transactions and PayTraQer help you to keep the data updated with your QuickBooks online by automating the data management process. Small business owners can integrate them seamlessly with QBO or Xero and get things done within minutes, thus enabling you to get a hold of great cash flow management.
5. Days Payable Outstanding
It is another important financial metric that evaluates the number of days it takes for a business to pay its suppliers for products or services acquired on credit.
In other words, it measures how long a firm takes to pay its invoices to its suppliers.
Understanding DPO is essential for the owner of a small business to manage cash flow successfully.
A high DPO indicates that your business pays suppliers more slowly, which might help you preserve cash soon.
But, it's crucial to be conscious that a high DPO can also affect your relationships with suppliers, so you must keep an excellent relationship by making timely payments.
DPO = (Average accounts payable / cost of goods sold) |
For example, if your accounts payable amount is $1000 and your average daily cost of goods sold is $100, your DPO would be ten days.
It’s crucial to keep in mind that DPO might vary significantly according to the industry and the terms established with suppliers.
As a small company owner, you should frequently review your DPO to ensure you pay your bills on time and maintain credibility with your suppliers.

6. Accounts Receivable Turnover
It’s a cash flow indicator that shows how quickly a firm collects money from its customers. Understanding this will help you analyze the effectiveness of your credit and collection procedures.
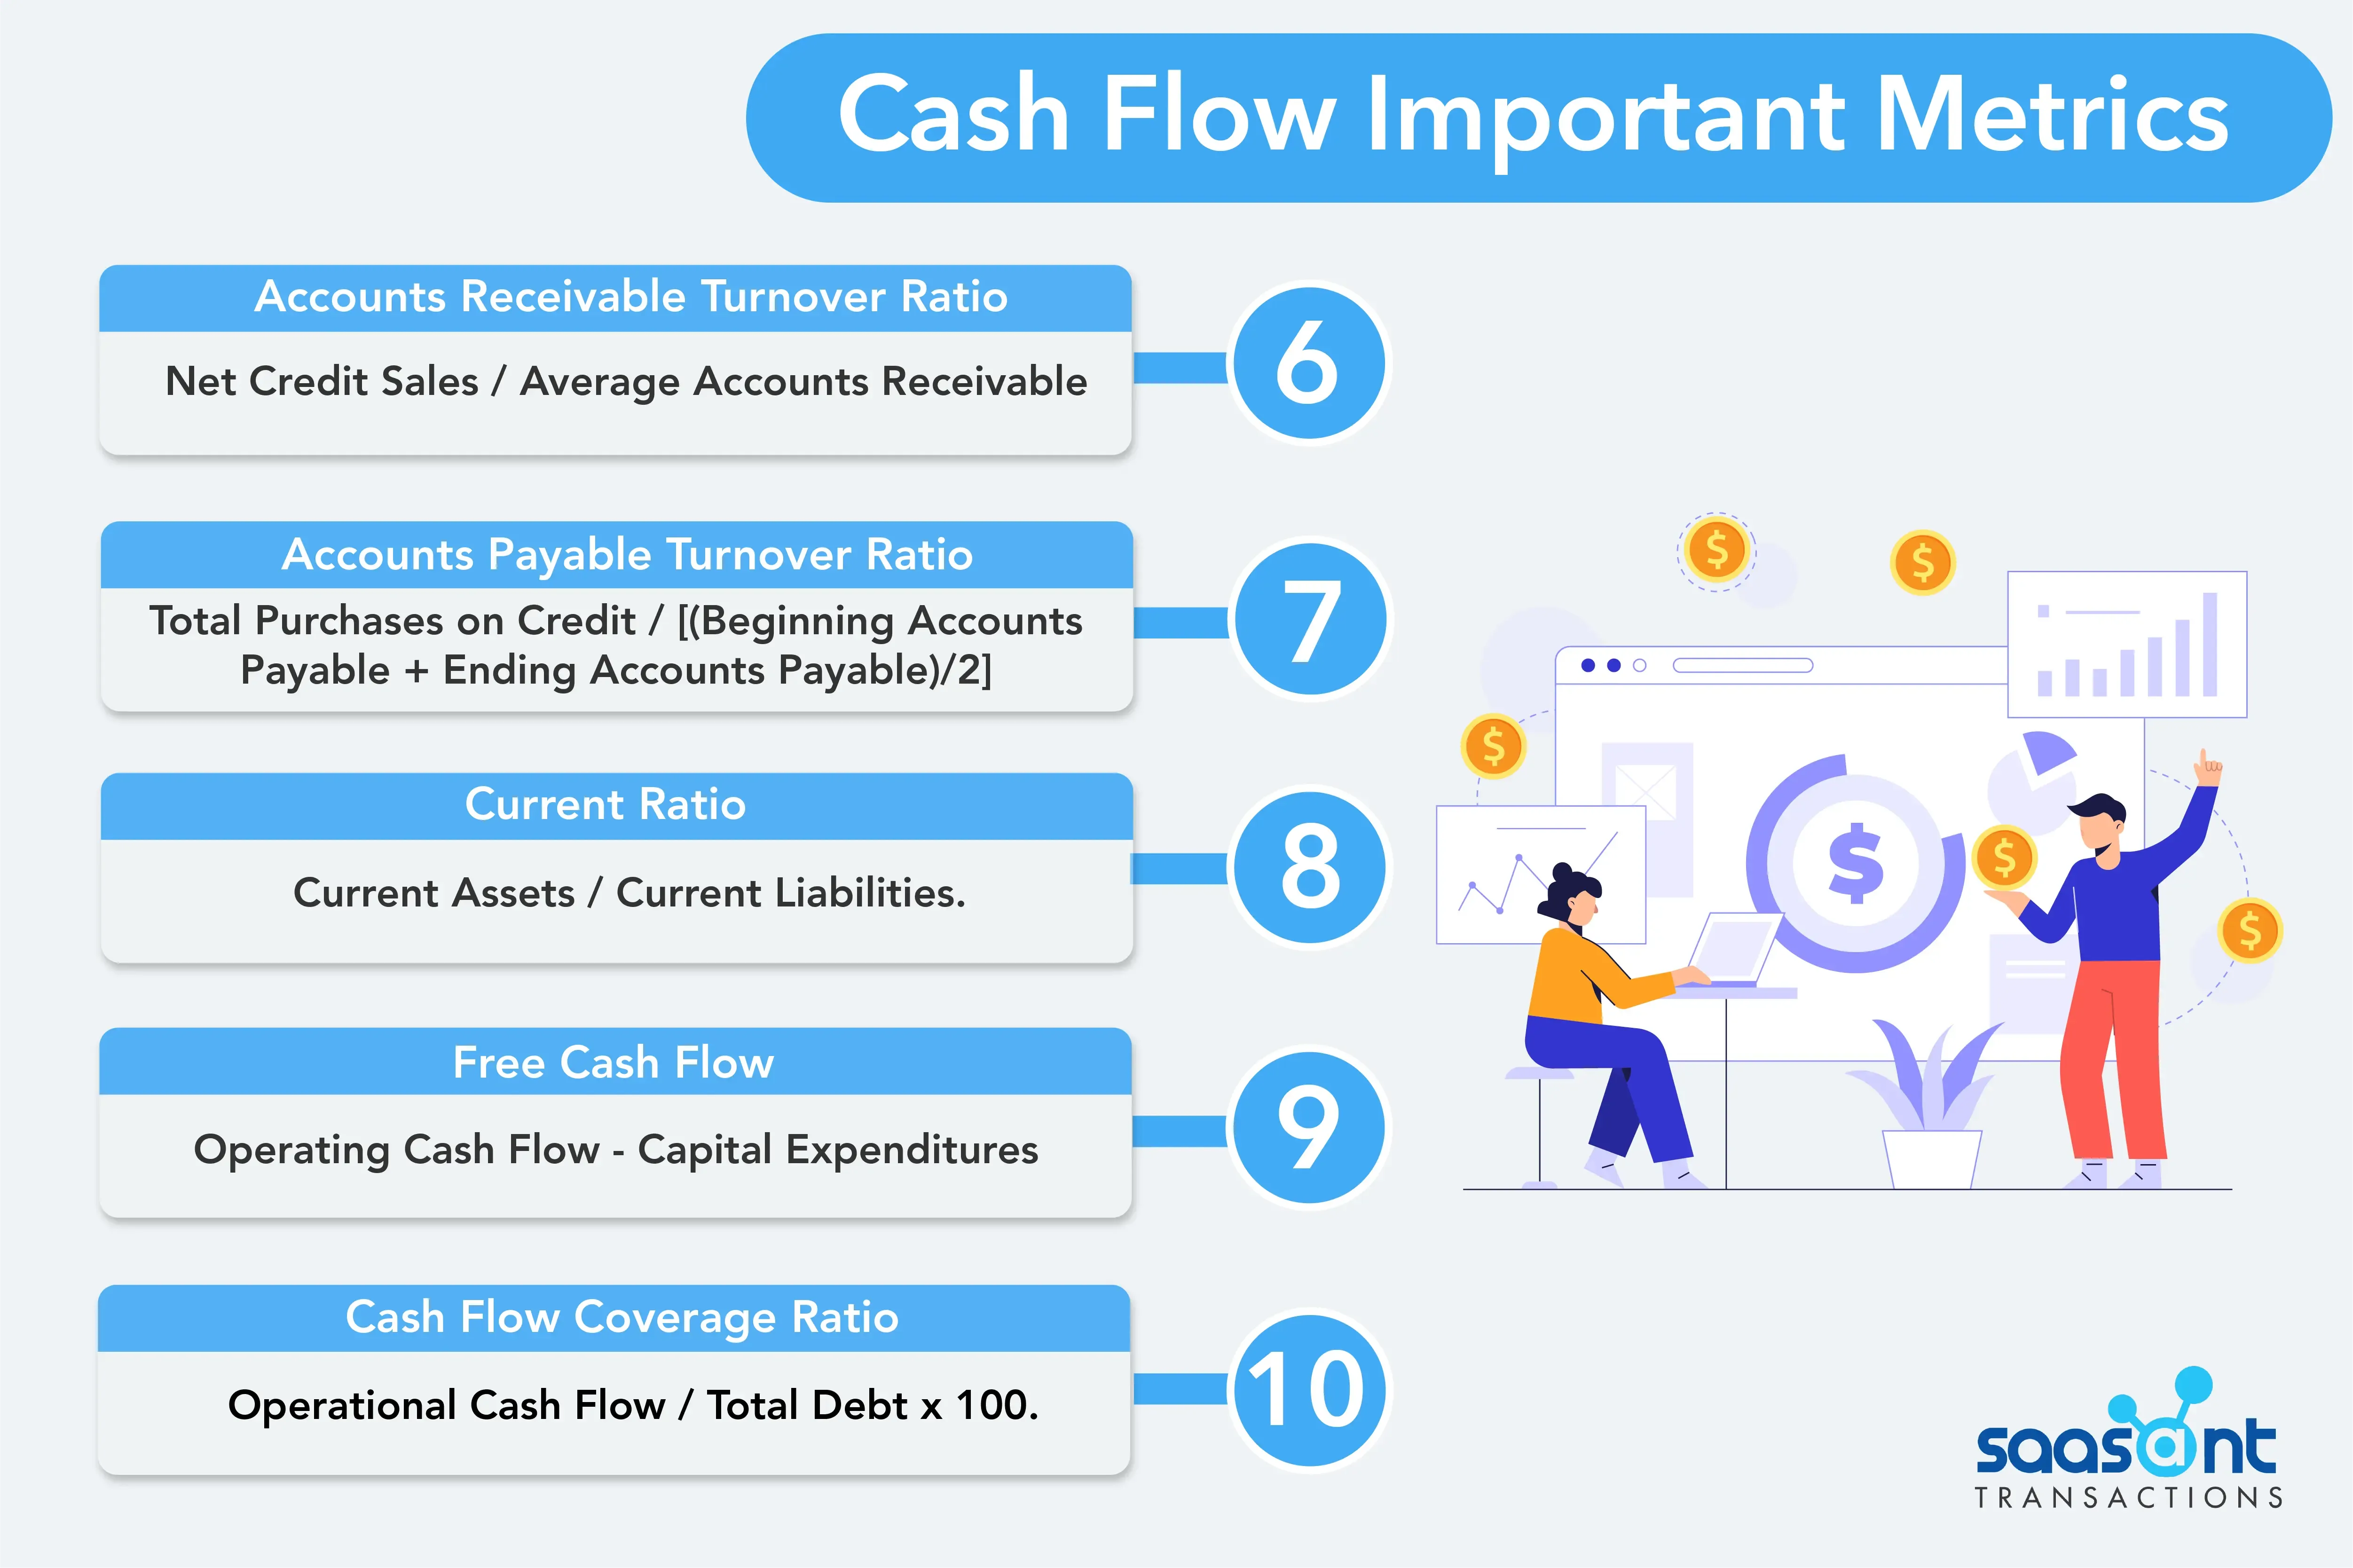
Accounts receivable turnover ratio = Net credit sales / Average accounts receivable |
The resultant figure shows how often your accounts receivable turnover for a particular time. A greater ratio shows that your firm efficiently collects money from clients, while a lower ratio indicates that your organization may be facing troubles with cash collection.
For example, let's assume your firm had $5000 in sales last year, and your average accounts receivable amount was $500. Your accounts receivable turnover ratio would be 10 ($5000/$500).
This indicates that your accounts receivable amount turned over ten times yearly.
A high accounts receivable turnover ratio is good since it implies that your organization collects money quickly and effectively.
Conversely, a low ratio may signal that you need to enhance your credit and work on collection practices to lessen the time it takes to collect payments.
7. Accounts Payable Turnover
This metric allows small business owners to evaluate how fast they pay their bills to customers and suppliers. It is a ratio that quantifies the number of times an organization pays off its accounts payable within a given time frame, often one year.
Accounts payable turnover ratio = Total purchases on credit / [(beginning accounts payable + ending accounts payable)/2] |
For a small firm with $5000 in purchases and an average accounts payable amount of $500, the accounts payable turnover ratio would be 10 ($5000/$500).
A high accounts payable turnover ratio shows that a company is paying its bills to suppliers quickly; in contrast, a low ratio may indicate that it is paying its bills more slowly.
This indicator allows small business owners to analyze their payment performance and discover chances to increase their cash flow by properly managing their accounts payable.
A greater accounts payable turnover percentage may also reflect a positive working relationship with suppliers and vendors, which can result in more favorable terms and discounts.
8. Current Ratio
It evaluates a company's capacity to pay down its short-term commitments with its current assets. As a small business owner, understanding your current ratio is vital since it may help you measure your company's liquidity and financial health.
Current Ratio = Current Assets / Current Liabilities. |
For example, imagine that your small firm has $5000 in current assets and $2500 in current liabilities.
Current Ratio = $5000 / $2500
Current Ratio = 2:1
This shows that your business has $2 in current assets for every $1 in current liabilities. Typically, a current ratio of 1:1 or greater is regarded as good since it implies that your organization has enough current assets to meet its short-term debts.
However, the optimal current ratio might vary based on the industry, company strategy, and other variables.
Thus, it is essential to compare your current ratio to industry standards and historical patterns to assess if it is suitable for your business.
9. Free Cash Flow
It measures a company's capacity to generate cash from its operational activities after accounting for capital expenditures necessary to maintain or expand the business. It is a critical number for small business owners to grasp, as it may assist them in evaluating the available amount to reinvest or distribute to investors.
Free Cash Flow = Operating Cash Flow - Capital Expenditures |
Operational Cash Flow is the cash created by a company's typical business activities, such as the difference between sales revenue and operating expenditures.
On the other hand, capital expenditures are the money spent on investing in long-term assets like land, plant, and equipment necessary to maintain or develop the business.
Look at this example,
Suppose a business owner earned $5000 in sales and spent $4000 in operating expenditures over the year, resulting in $1000 in operational cash flow. In addition, the business spent $500 on new fixtures and equipment to improve operational activities.
It shows that the business made $500 in cash, and it can be used to reinvest in the business. A positive FCF is viewed as a good sign for a business earning cash from its operations and having great potential for future growth and expansion.
10. Cash Flow Coverage Ratio
This metric estimates the company’s potential to repay debts with the operational cash flow.
Cash flow coverage ratio = Operational cash flow / Total Debt x 100. |
Let’s assume a company earns $4000 in the previous year from operational activities, and its total debt is $8000.
Then the CFCR is ($4000/$8000) x 100 = 50%
The business can now calculate the time required to pay the debt, assuming this ratio remains constant.
Then = 1/50%
= 1/(50/100)
= 2 years.
You can repay the total debt within two years.
When the company knows the years required to pay off the debt, you can plan accordingly to keep your business sustainable and growing.
In the business world, cash flow ensures you have enough gas to complete milestone after milestone, such as growth, profitability, and financial health. So, always be keen on cash flow and its metrics. Who knows! You can expand your small business to a big organization like Michael Dell expanded his business. But smart choices are required to make it possible such as opting for automation tools like SaasAnt Transactions or PayTraQer to reduce the workload, thus optimizing operational cost and saving time.
