How to Calculate Average Inventory: Formula, Examples, and Key Metrics
As a business owner that deals with physical goods, how often do you calculate average inventory? When the shopping season approaches, you must ensure your inventory levels align with demand. We get it. It’s stressful, but you can’t ignore it because tracking inventory helps you assess financial health and make informed purchasing, production, and pricing decisions.
This blog is all about guiding you through the process of calculating average inventory. We'll explore different methods, provide examples, and discuss the importance of accurate inventory tracking for your business's financial health.
Contents
What Is Average Inventory?
Why Is Average Inventory Important?
Who Should Calculate Average Inventory?
How to Calculate Beginning, Ending Inventory, and COGS
How to Calculate Average Inventory? (Formula + Examples)
What is the Inventory Turnover Ratio?
How to Calculate Average Days in Inventory?
The Limitations of Average Inventory
Application to Track Inventory
Wrap Up
FAQ
What Is Average Inventory?
Average inventory is the value businesses own over two or more accounting periods. It is calculated by adding each period's beginning and ending inventory and dividing the sum by the number of periods.
You can determine the ideal amount to maintain when you know how to calculate the average inventory. It prevents understocking, which can lead to lost sales, and overstocking, which can tie up capital.
For instance, a company with a rising inventory average might require additional storage or staff. Conversely, a declining inventory average could allow for cost reductions by minimizing stock levels.
Why Is Average Inventory Important?
Average inventory is a crucial metric for businesses, especially those dealing with seasonal goods or fluctuating demand. By tracking this metric, businesses can better understand purchasing and manufacturing trends for future sales. This knowledge helps them optimize stock levels to meet customer demand without overstocking or understocking.
Additionally, average inventory can impact operational costs. High inventory levels might require more storage space and staffing, while low levels could lead to stockouts and lost sales. Inventory managers use this metric to assess the efficiency of inventory management and identify opportunities for improvement, such as optimizing inventory turnover or reducing holding costs.
Who Should Calculate Average Inventory?
Calculating average inventory can benefit businesses of all sizes, from small retail stores to large manufacturing companies. By understanding their inventory levels and turnover rate, businesses can make informed decisions about purchasing, pricing, and marketing strategies.
Typically, inventory managers are responsible for calculating average inventory. They often rely on stocktaking processes to physically count and record inventory levels. However, manual stocktaking can be time-consuming and less sustainable.
Inventory management software like PayTraQer can automate counting stock and calculating average inventory. By tracking inventory levels in real-time, PayTraQer can help businesses:
Calculate accurate Cost of Goods Sold (COGS): PayTraQer can track inventory purchases, sales, and returns to calculate COGS accurately, which is essential for financial reporting and tax purposes.
Optimize inventory levels: By analyzing historical and current sales data, PayTraQer can help businesses identify optimal stock levels to avoid stockouts and excess inventory.
How to Calculate Beginning, Ending Inventory, and COGS
Before getting into how to calculate, let’s understand the terms involved in calculating average inventory.
Understanding the Terms
Beginning Inventory: The inventory on hand at the start of an accounting period.
Ending Inventory: The inventory on hand at the end of an accounting period.
COGS (Cost of Goods Sold): The total cost of inventory sold during a period.
Formulas and Example
1. COGS Formula
COGS = Beginning Inventory + Purchases - Ending Inventory
Example:
Beginning Inventory = $10,000
Purchases = $20,000
Ending Inventory = $8,000
COGS = $10,000 + $20,000 - $8,000 = $22,000
2. Beginning Inventory Formula
Beginning Inventory = COGS + Ending Inventory - Purchases
Example:
COGS = $22,000
Ending Inventory = $8,000
Purchases = $20,000
Beginning Inventory = $22,000 + $8,000 - $20,000 = $10,000
3. Ending Inventory Formula
Ending Inventory = Beginning Inventory + Purchases - COGS
Example:
Beginning Inventory = $10,000
Purchases = $20,000
COGS = $22,000
Ending Inventory = $10,000 + $20,000 - $22,000 = $8,000
These formulas are interconnected and can calculate any of the three variables based on the known values.
How to Calculate Average Inventory? (Formula + Examples)
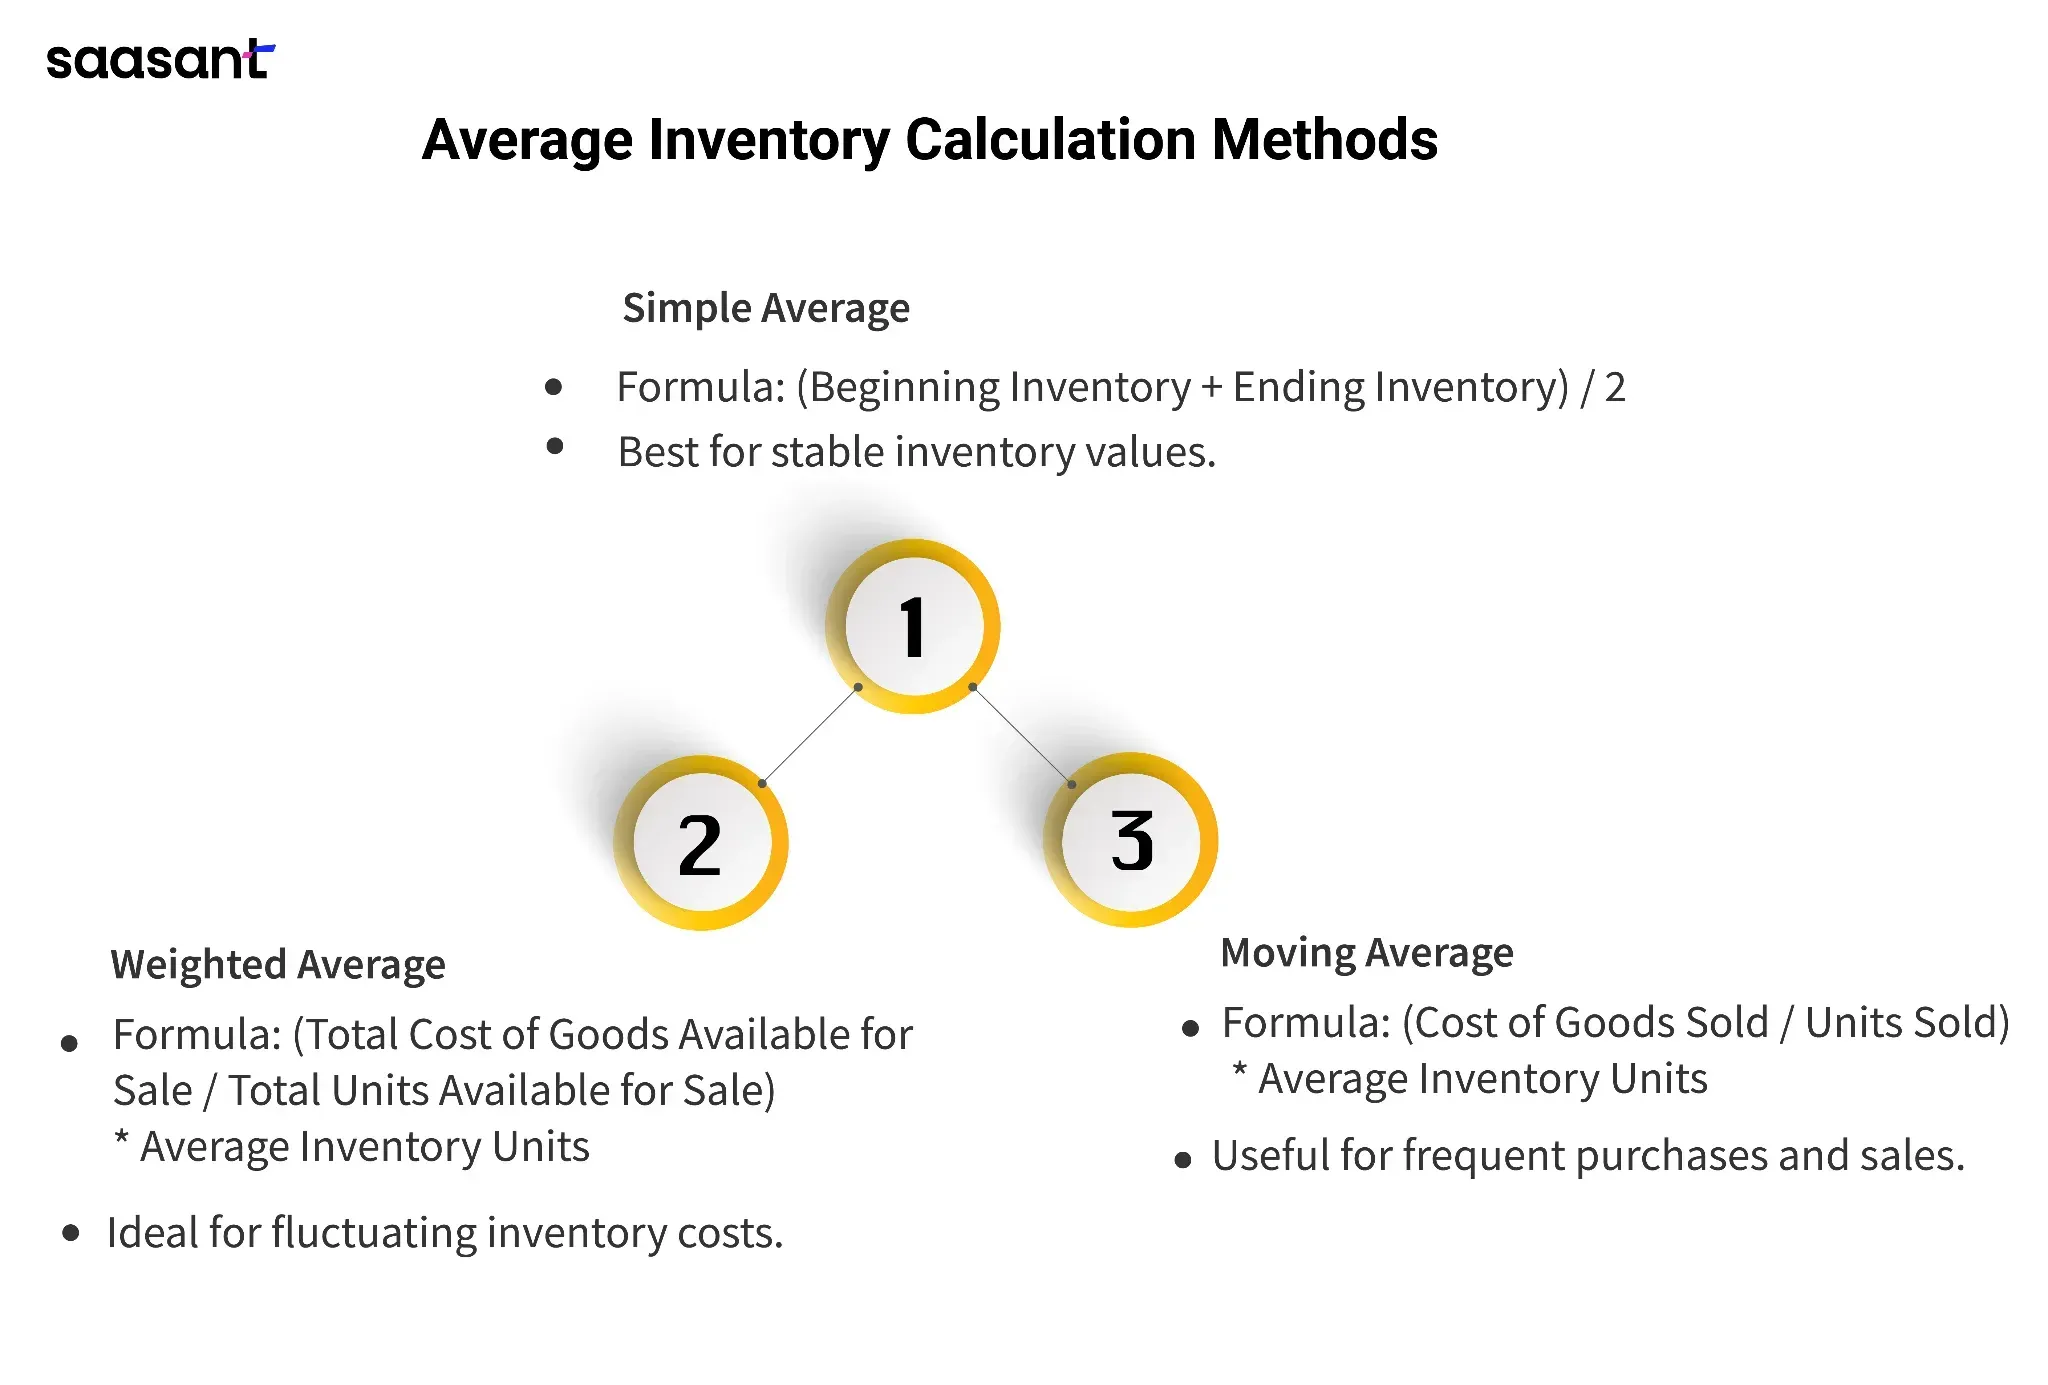
There are three primary methods to calculate average inventory, and the most suitable method depends upon your business's specific circumstances. Here are the average inventory calculation formulas.

Simple Average Method
This is the most straightforward approach to finding the average inventory. It suits businesses with relatively stable inventory values throughout the average inventory period. It simply calculates the average of the beginning and ending inventory values.
Formula:
Average Inventory = (Beginning Inventory + Ending Inventory) / 2
Example:
Beginning Inventory = $10,000
Ending Inventory = $12,000
Average Inventory = ($10,000 + $12,000) / 2 = $11,000
Weighted Average Method
This method is ideal for businesses with fluctuating inventory costs. It assigns weights to each purchase based on price and quantity, accurately representing the average inventory value.
Formula:
Weighted Average Cost per Unit = Total Cost of Goods Available for Sale / Total Units Available for Sale
Average Inventory = Weighted Average Cost per Unit * Average Inventory Units
Example:
Purchase 1: 100 units at $10 each
Purchase 2: 200 units at $12 each
Ending Inventory: 150 units
Weighted Average Cost per Unit = ($1000 + $2400) / (300) = $11.33
Average Inventory = $11.33 * 150 = $1699.50
Moving Average Method
This method is beneficial for businesses with frequent inventory purchases and sales. It calculates a new average cost for each unit purchased, considering the costs of previous purchases.
Formula:
Cost of Goods Sold = (Beginning Inventory + Purchases) - Ending Inventory
Average Cost per Unit = Cost of Goods Sold / Units Sold
Average Inventory = Average Cost per Unit * Average Inventory Units
Example:
(Assume similar purchases and sales as the Weighted Average Method)
Cost of Goods Sold = ($1000 + $2400) - $1699.50 = $1700.50
Average Cost per Unit = $1700.50 / 200 = $8.50
Average Inventory = $8.50 * 150 = $1275
What is the Inventory Turnover Ratio?
The inventory turnover ratio measures how efficiently a business manages its inventory. The ratio is calculated as the cost of Goods Sold divided by the average Inventory.
A high inventory turnover ratio generally indicates that a business is selling its inventory quickly, which can be a positive sign.
However, an excessively high ratio might suggest the business underestimates its inventory or experiences inaccurate valuation. On the other hand, a low ratio could indicate that the industry is holding onto inventory for too long, which can tie up capital and affect profitability.
How to Calculate Average Days in Inventory?
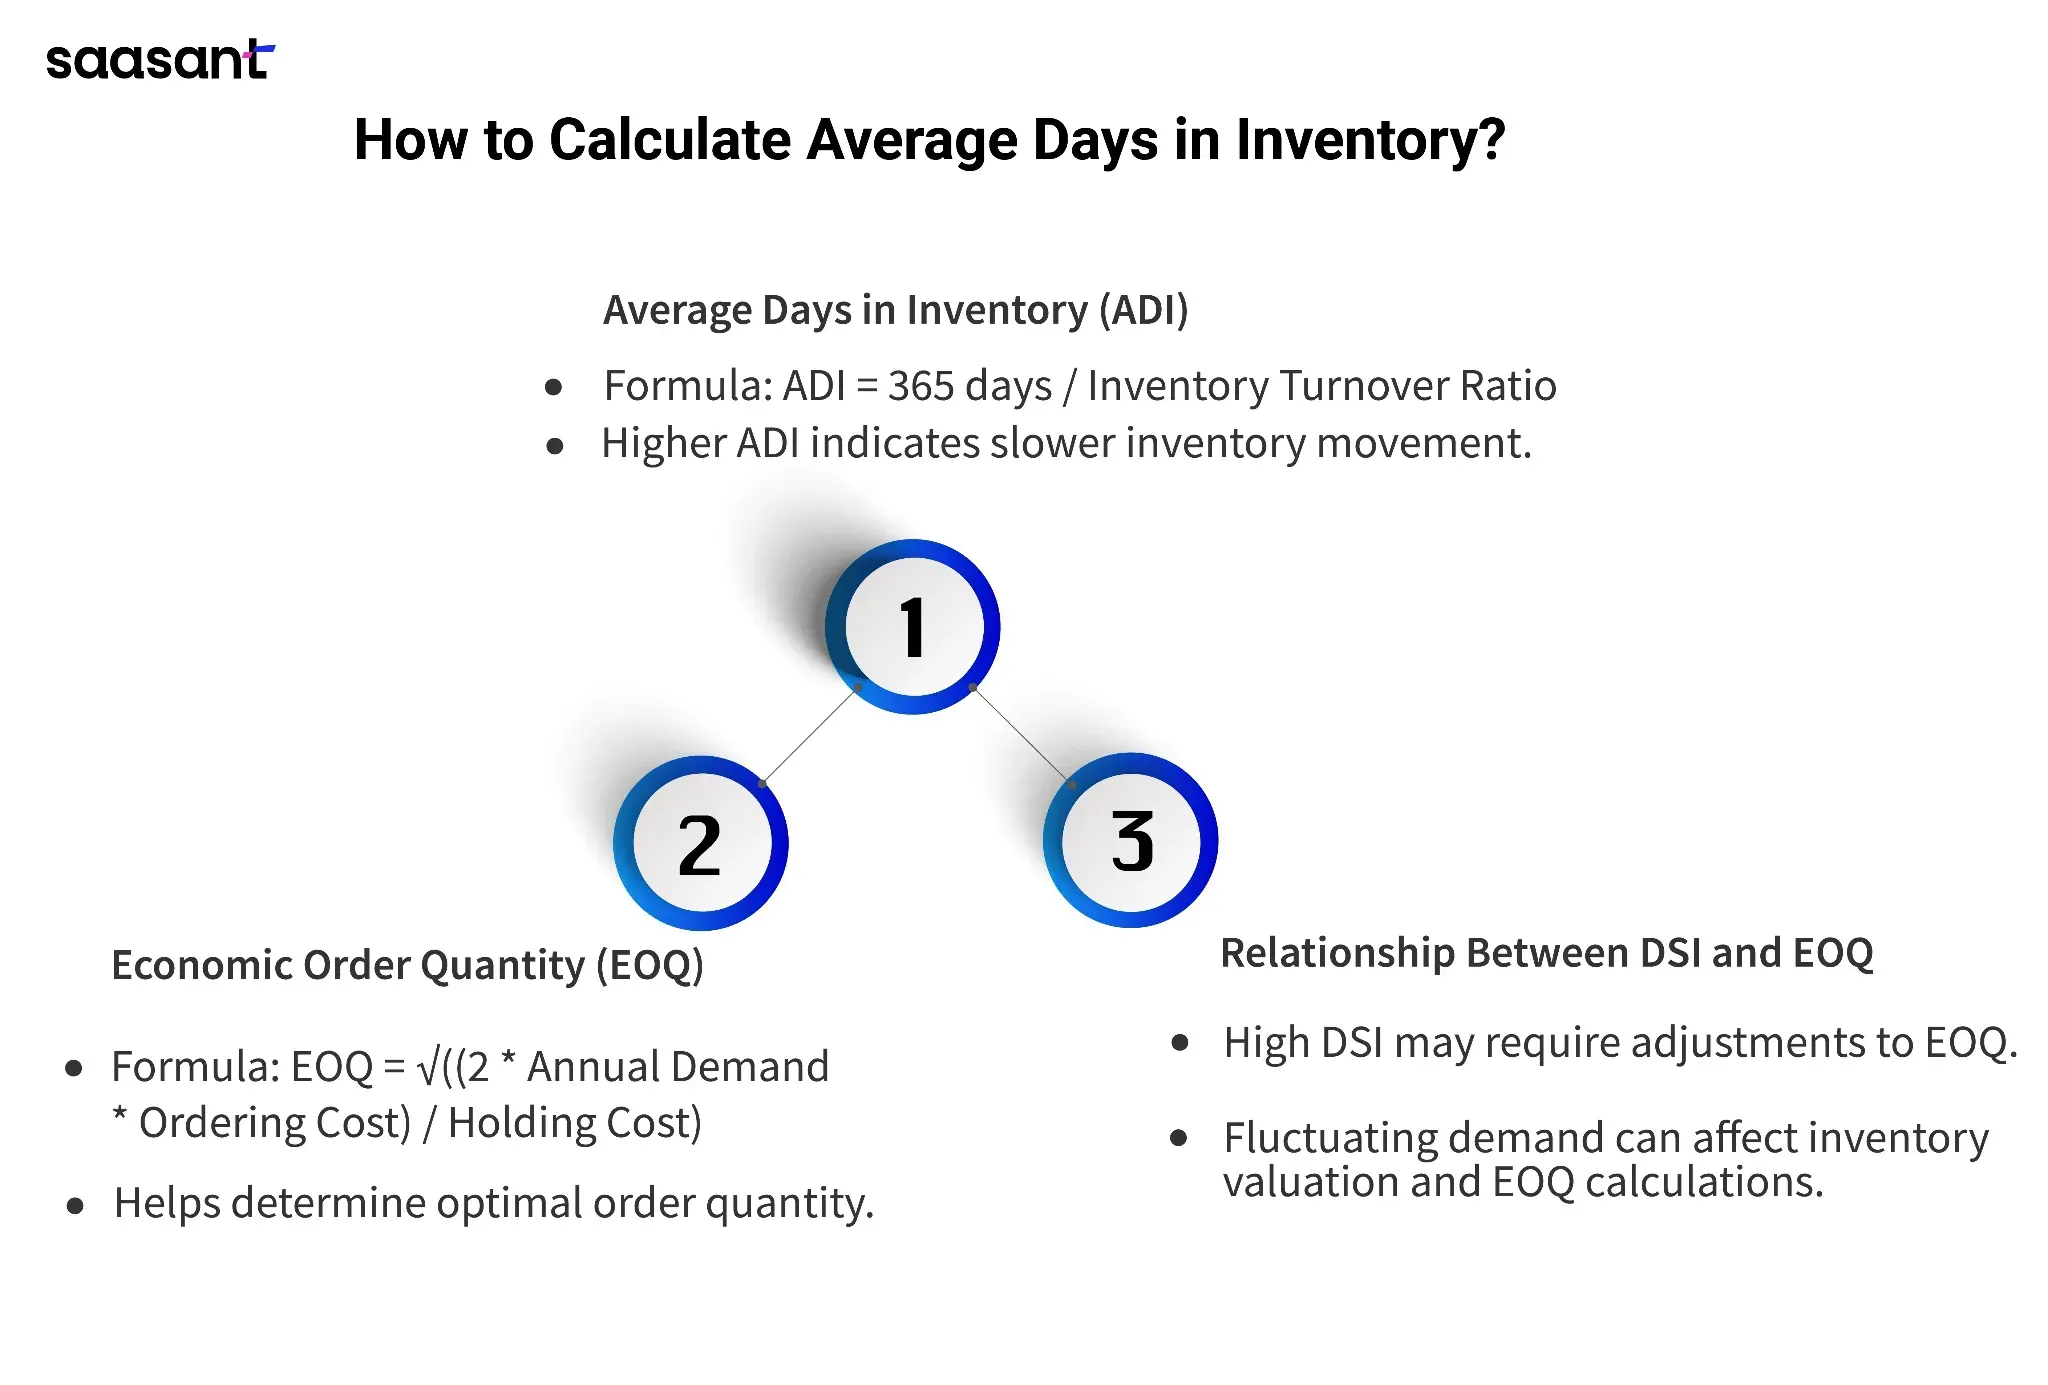
 Average Days in Inventory (ADI) measures how long a company can sell its inventory. It is calculated as:
ADI = 365 days / Inventory Turnover Ratio
DSI (Days Sales in Inventory) is another term for ADI. It helps assess inventory efficiency.
EOQ (Economic Order Quantity) is a model to determine the optimal order quantity for inventory. It helps prevent understocking or overstocking.
The formula for EOQ:
EOQ = √((2 Annual Demand Ordering Cost) / Holding Cost)
Example:
If a company has an annual demand of 10,000 units, an ordering cost of $100 per order, and a holding cost of $2 per unit, the EOQ would be:
EOQ = √((2 10,000 100) / 2) = 1000 units
DSI and EOQ are interrelated. If a company's DSI is high, it might need to adjust its EOQ to restock and frequently meet the high demand for goods. However, if demand fluctuates, inventory valuation and average inventory estimates can affect EOQ calculations.
The Limitations of Average Inventory
While average inventory is a valuable metric, it has limitations. It provides a snapshot of inventory levels over a specific period but doesn't account for fluctuations within that period. Additionally, it doesn't consider the value of inventory, focusing solely on quantity. To gain a more comprehensive understanding of inventory performance, businesses should consider additional metrics like inventory turnover ratio and days sales of inventory.
Application to Track Inventory
If you are a business owner who needs to improve inventory management and prevent understocking or overstocking, accurately track COGS, analyze overall sales volume, and make informed decisions about inventory valuation and adjustments due to fluctuating inventory levels, then you need PayTraQer.
PayTraQer’s COGS calculation accurately tracks your purchases, sales, and inventory levels and helps you determine the actual cost of the goods you've sold. This information is essential for accurate financial reporting and decision-making.
One key benefit of using PayTraQer is its seamless integration with popular accounting software like QuickBooks and Xero. This means that your inventory data can be automatically synced with your accounting system, eliminating the need for manual data entry and reducing the risk of errors.
Wrap Up
Calculating average inventory shows how effectively a business manages its inventory and finances. Understanding the various methods to calculate average inventory can give you valuable insights into your operations.
Remember, while average inventory is a crucial metric, it has limitations. It doesn't account for inventory valuation changes or seasonal fluctuations in demand. To improve inventory management, consider using tools like PayTraQer to track COGS, analyze overall sales volume, and make data-driven decisions.
Accurately calculating average inventory and implementing effective management strategies can optimize business operations, reduce costs, and improve profitability.
FAQ
What is the formula for average inventory?
Average Inventory = (Beginning Inventory + Ending Inventory) / 2. This formula calculates the average value of inventory held during a period. It's a simple way to assess inventory levels and inform purchasing decisions.
How do you calculate average inventory units?
Average Inventory Units = (Beginning Inventory Units + Ending Inventory Units) / 2.
This formula calculates the average number of inventory units held during a period. It helps understand inventory turnover and make decisions about production or purchasing.
How to calculate the inventory formula?
To calculate inventory, you need to know the beginning inventory, ending inventory, and purchases made during the period. Here's the formula: Inventory = Beginning Inventory + Purchases - Ending Inventory. This formula helps you determine the total inventory value on hand at any given time.
What is the formula for average cost of inventory?
Average Cost of Inventory = Total Cost of Goods Available for Sale / Total Units Available for Sale. This formula determines the average cost per unit of inventory when multiple purchases are made at different prices. It's a standard method for valuing inventory in accounting.