How To Calculate Total Revenue?

Total revenue is significant as it represents all income a business generates from its various revenue streams. This figure reflects an organization's financial health and provides insights into its market demand, growth potential, and overall viability in the industry. By comprehensively analyzing total revenue, businesses can gain a deeper understanding of their revenue sources, identify areas of strength and weakness, and formulate strategies to drive sustainable growth. This article will provide you’ll provide you with all the information you need to know about total revenue and ways to calculate your total revenue.
What is Total Revenue?
In business and finance, total revenue is the culmination of all income streams generated by a company over a specific period. This encompasses revenue accrued from various sources such as sales of goods or services, licensing fees, royalties, subscriptions, and other income forms. Total revenue represents all monetary inflows from a business's core operational activities.
Businesses aggregate, gather, and compile income data from different revenue streams to determine total revenue. This involves the summation or income summation of revenues from each source, ultimately arriving at the total revenue figure. This revenue accumulation and financial aggregation process provides a comprehensive snapshot of a company's income-generating capacity.
Importance of Total Revenue in Business:
The significance of total revenue in business must be balanced. It is a cornerstone for evaluating a company's financial performance and health. Revenue metrics are essential in financial performance evaluation, providing stakeholders valuable insights into the company's revenue dynamics and overall economic well-being.
Relationship between Total Revenue and Price Elasticity of Demand:
The relationship between total revenue and price elasticity of demand plays a pivotal role in shaping revenue dynamics. Price elasticity of demand measures consumer demand's responsiveness to price changes. Understanding this relationship is essential for predicting revenue elasticity and assessing the impact of pricing decisions on total revenue.
In markets characterized by elastic demand, small changes in price lead to proportionally more significant changes in the quantity demanded. As a result, changes in price elasticity influence total revenue dynamics. Conversely, in markets with inelastic demand, price changes have a relatively minor impact on the quantity demanded, affecting total revenue differently.
The correlation between price elasticity and total revenue highlights the importance of balancing pricing strategies with revenue objectives. By analyzing total revenue fluctuations in response to changes in price elasticity, businesses can optimize pricing decisions to maximize revenue while maintaining market competitiveness.
Understanding total revenue is essential for businesses seeking to thrive in today's competitive landscape. By comprehending its definition, recognizing its importance, and understanding its relationship with the price elasticity of demand, businesses can unlock valuable insights to drive sustainable growth and profitability.
Components of Total Revenue Calculation: Understanding the Basics
Unit Price (P):
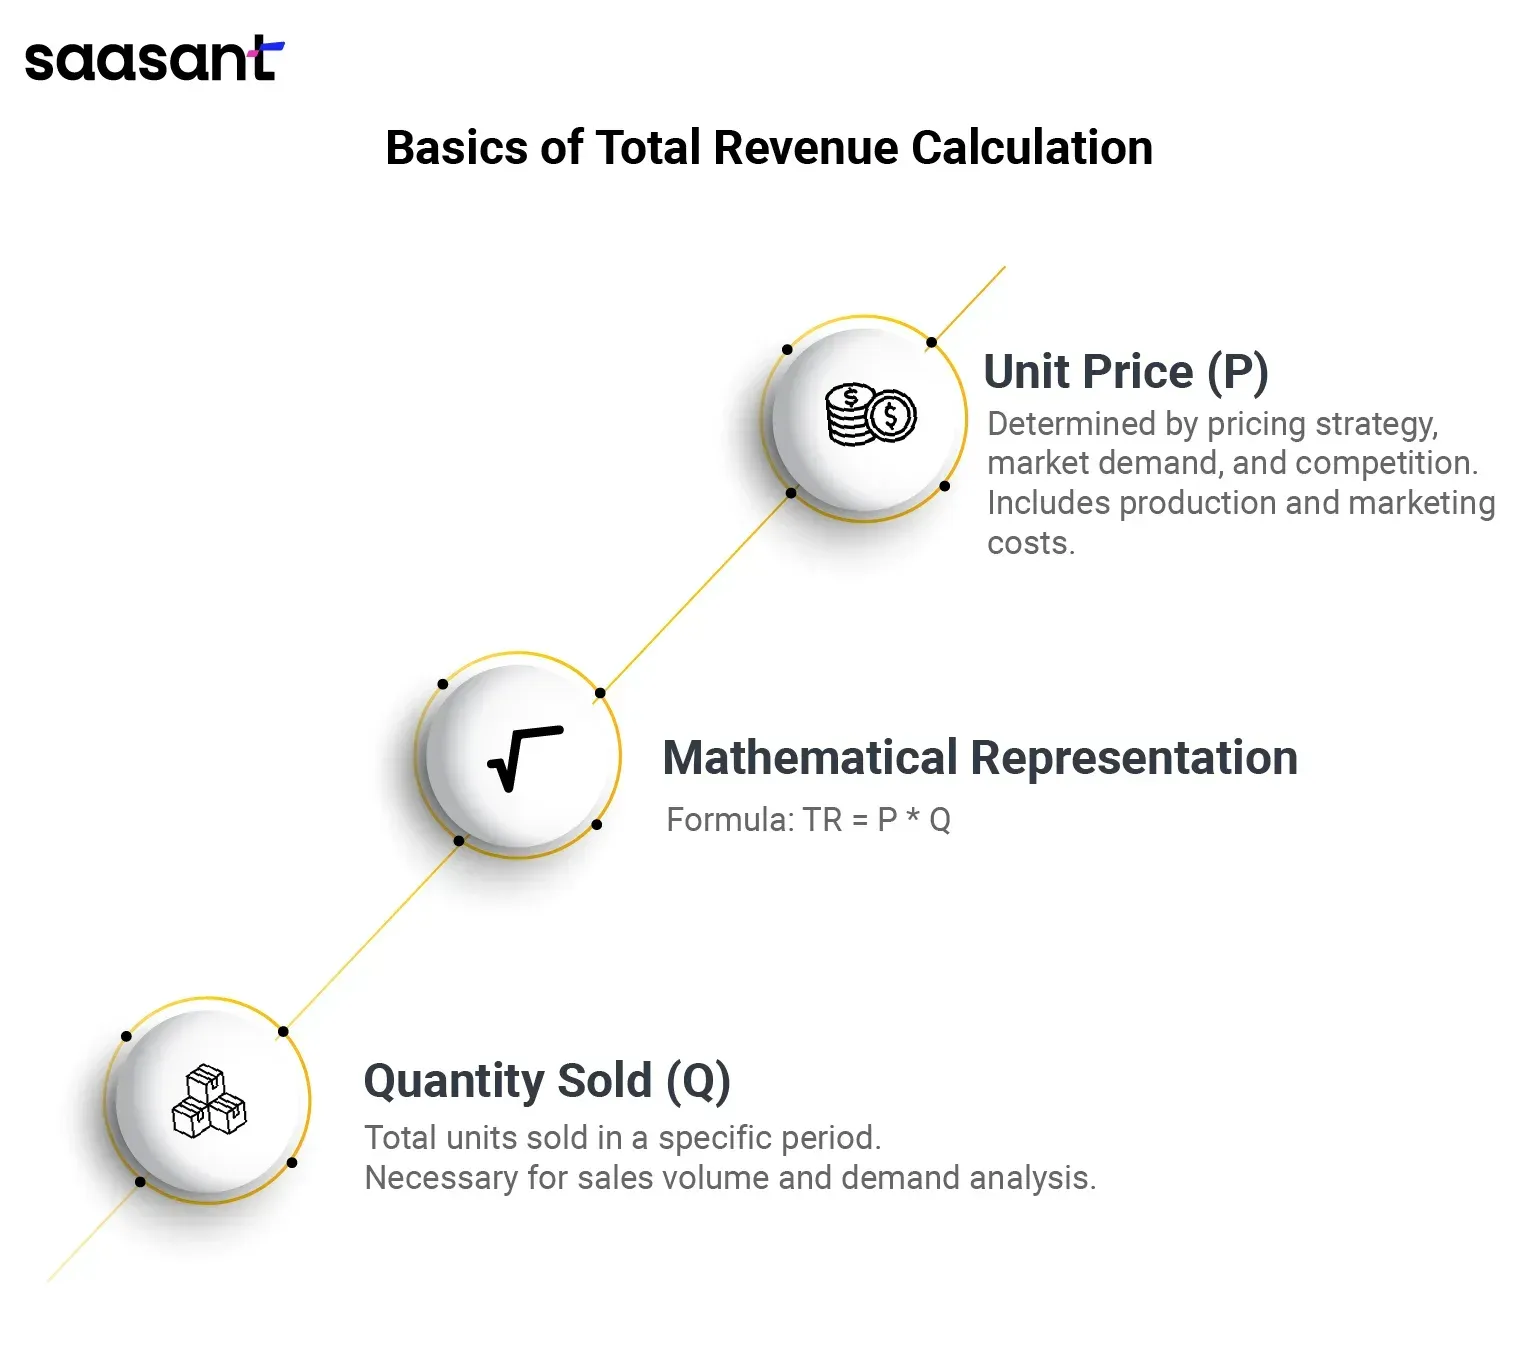
Unit price, denoted as P, is a fundamental component of total revenue calculation. It represents the price at which a single unit of a product or service is sold. Unit price determination is influenced by various factors, including the company's pricing strategy, market demand, competition, and production costs. Pricing strategy plays a crucial role in setting the selling price, as businesses aim to maximize revenue while remaining competitive.
Effective product pricing requires careful consideration of value proposition, customer preferences, and perceived product quality. Businesses can optimize their pricing strategies by analyzing market trends and consumer behavior to enhance profitability and maintain market relevance. Additionally, unit cost, which comprises production, distribution, and marketing expenses, influences the determination of the selling price. Price optimization involves striking a balance between maximizing profit margins and ensuring product affordability for customers.
Quantity Sold (Q):
Quantity sold, represented by Q, is another essential component of total revenue calculation. It refers to the total number of units sold within a specific period. Understanding sales volume and product demand is crucial for accurately forecasting and managing revenue generation. Sales quantity analysis enables businesses to identify trends, assess performance, and make informed decisions regarding production levels, inventory management, and marketing strategies.
Demand forecasting is critical in estimating future sales volume and aligning production capacity accordingly. By analyzing historical sales data, market trends, and external factors such as economic conditions and consumer preferences, businesses can develop accurate demand forecasts to optimize resource allocation and minimize inventory costs. Quantity distribution involves determining the optimal allocation of products across different sales channels to maximize reach and revenue potential.
Mathematical Representation: TR = P * Q:
Total revenue (TR) is calculated by multiplying the unit price (P) by the quantity sold (Q). This mathematical representation, TR = P * Q, encapsulates the essence of total revenue calculation. It illustrates the direct relationship between unit price, quantity sold, and total revenue generation. By applying this total revenue formula, businesses can determine their total sales revenue and assess their financial performance.
The total revenue equation is a cornerstone in financial analysis, providing insights into a company's revenue-generating capacity and overall business health. The calculation formula facilitates revenue computation and enables businesses to track revenue trends, identify growth opportunities, and make strategic decisions to enhance profitability. Revenue modeling and projection involve using historical data and market insights to forecast future revenue streams, guiding strategic planning and resource allocation.
Understanding the components of total revenue calculation is essential for businesses seeking to optimize revenue generation and drive sustainable growth. By focusing on unit price, quantity sold, and mathematical representation, companies can develop effective pricing strategies, maximize sales volume, and enhance overall financial performance.
Components of a Step-by-Step Guide to Calculating Total Revenue
Gather Necessary Data:
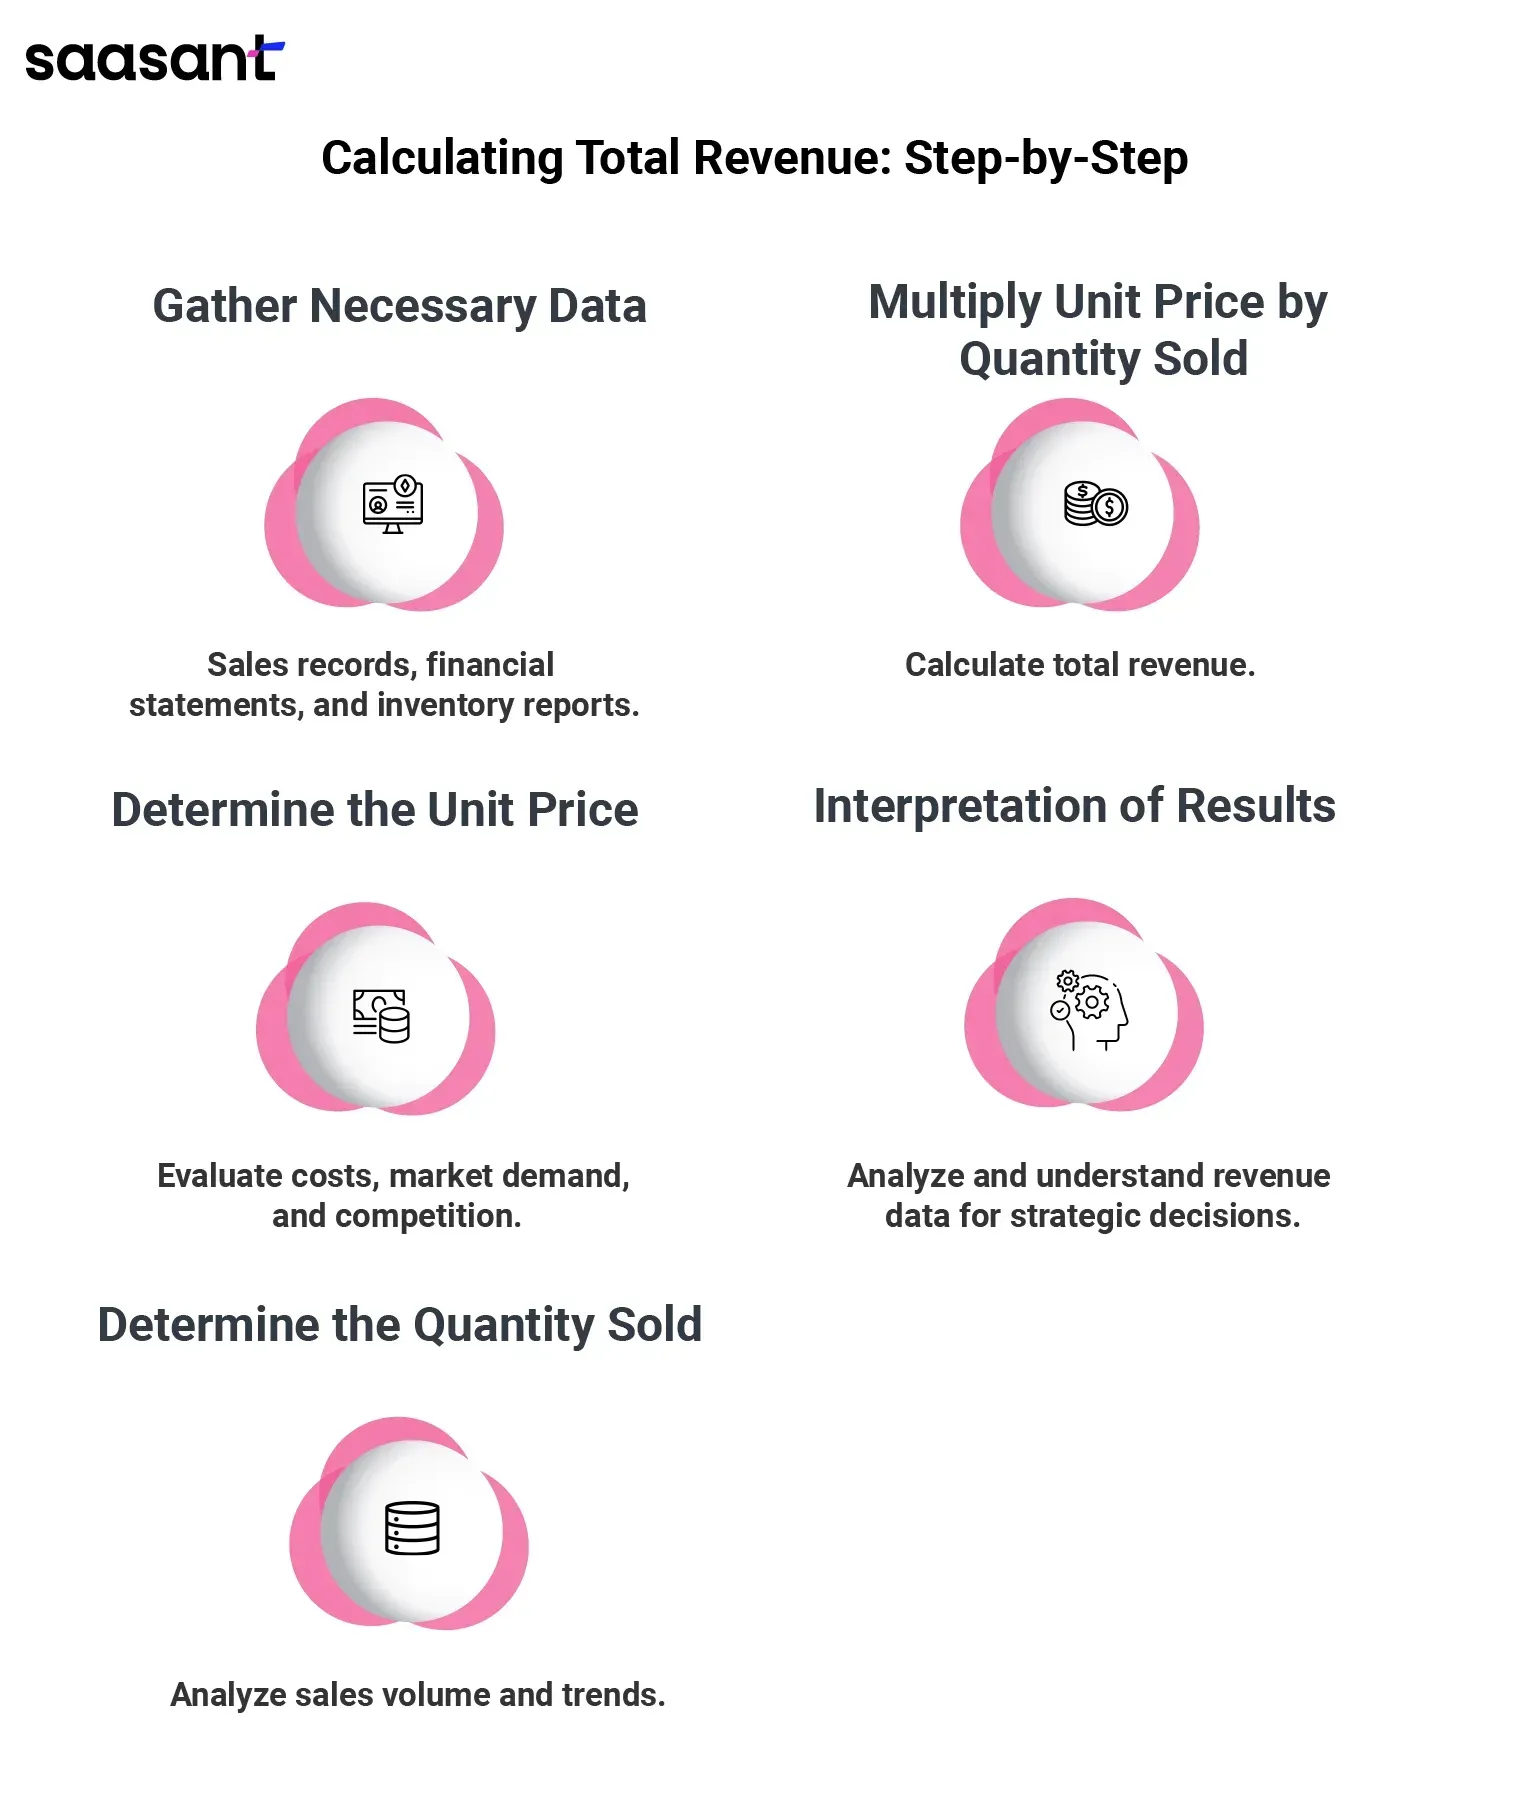
Before calculating total revenue, the first crucial step is to gather all the necessary data. This involves thorough data collection from various relevant sources to ensure accuracy and completeness. Relevant data sources may include sales records, financial statements, inventory reports, and other sources that provide information on revenue-generating activities. Data compilation involves aggregating and organizing the gathered data into a format suitable for analysis. It's essential to retrieve all required data elements to ensure a comprehensive study and accurate calculation of total revenue.
Determine the Unit Price:
Once the necessary data is gathered, the next step is determining the unit price of the product or service sold. This involves pricing determination, where businesses assess various factors such as production costs, market demand, competition, and pricing strategies. Price assessment requires careful product pricing analysis and evaluating its competitiveness and profitability in the market. Pricing evaluation helps set the selling price at a level that maximizes revenue while aligning with business objectives. Establishing a pricing model and implementing a pricing strategy are integral to determining the unit price.
Determine the Quantity Sold:
After determining the unit price, the focus shifts to quantifying the quantity sold. Sales volume determination involves assessing the demand for the product or service and estimating the sales volume within a specified period. Quantifying sales requires analyzing sales quantity data, evaluating sales performance, and assessing product demand based on market trends and customer behavior. Quantity sold analysis helps businesses understand their sales volume, identify patterns, and make informed decisions regarding production levels and inventory management.
Multiply Unit Price by Quantity Sold:
With the unit price and quantity sold determined, the next step is to calculate total revenue by multiplying the unit price by the quantity sold. This revenue calculation process involves straightforward multiplication, multiplying the unit price by the quantity sold to arrive at the total revenue figure. Revenue generation is the outcome of this multiplication process, representing the total income generated from sales activities. Total revenue determination is crucial for assessing the business's financial performance and making strategic decisions.
Interpretation of Results:
Once the total revenue is calculated, the final step is to interpret the results. This involves result analysis, where businesses analyze the revenue data to gain insights into their financial performance. The interpretation process entails evaluating the revenue figures, understanding revenue trends, and assessing the implications of the results. Result interpretation helps in concluding, identifying areas for improvement, and making informed decisions to drive business growth. Understanding the significance of the results is essential for leveraging insights to optimize revenue generation and enhance overall business performance.
Real-World Examples and Applications of Total Revenue Calculation
Understanding and effectively calculating total revenue in the dynamic business landscape is crucial for informed decision-making and sustainable growth. Let's explore real-world examples and applications across different business scenarios.
Example 1: Calculating Total Revenue for a Product
Imagine a company that manufactures smartphones. The company needs to consider various factors to calculate the total revenue generated from a particular model. First, they determine the selling price of the smartphone, which includes production costs, marketing expenses, and desired profit margin. The selling price of the smartphone is $500.
Next, they assess the quantity of smartphones sold within a specific period, say 10,000 units. By multiplying the unit price ($500) by the quantity sold (10,000 units), they can calculate the total revenue generated from that product:
Total Revenue = Unit Price * Quantity Sold
Total Revenue = $500 * 10,000
Total Revenue = $5,000,000
This example illustrates how total revenue for a product can be calculated, providing insights into the financial performance of the product line.
Example 2: Total Revenue in Service-Based Businesses
Now consider a service-based business, such as a consulting firm. Total revenue calculation for such businesses involves a different approach. Let's take the example of a consulting project where the firm offers clients strategic planning services.
The firm determines the pricing for the consulting services based on factors like expertise, market demand, and project complexity. For example, they might charge a flat fee of $10,000 for the project.
Next, they need to assess the number of consulting projects completed within a specific timeframe. Let's assume they completed five projects during the quarter. By multiplying the unit price per unit ($10,000) by the quantity (5 projects), they can calculate the total revenue generated from consulting services:
Total Revenue = Unit Price * Quantity Sold
Total Revenue = $10,000 * 5
Total Revenue = $50,000
This example demonstrates how service-based businesses calculate total revenue, enabling them to evaluate their revenue streams and make informed business decisions.
Example 3: Total Revenue in a Multi-Product Scenario
Calculating total revenue becomes more complex in scenarios involving multiple products. Consider a retail chain offering a range of products across different categories.
The retail chain determines each product category's selling price and quantity. For example, if they sell smartphones, tablets, and accessories, they calculate the total revenue for each category using the respective unit prices and quantities sold.
Once the total revenue for each product category is determined, the revenues are aggregated to calculate the retail chain's overall total revenue.
This example showcases how businesses operating in multi-product scenarios calculate total revenue, allowing them to assess the performance of individual product lines and optimize their revenue mix.
These real-world examples highlight the diverse applications of total revenue calculation across different business models and industries. Understanding total revenue is essential for driving strategic decision-making and achieving business success, whether a single product, service-based offerings, or a multi-product portfolio.
Factors Influencing Total Revenue
Total revenue, the lifeblood of any business, is influenced by many factors that shape consumer behavior, market dynamics, and competitive landscapes. Understanding these factors is essential for companies seeking to optimize revenue generation and drive sustainable growth. Let's delve into three key factors that significantly impact total revenue:
Price Elasticity of Demand:
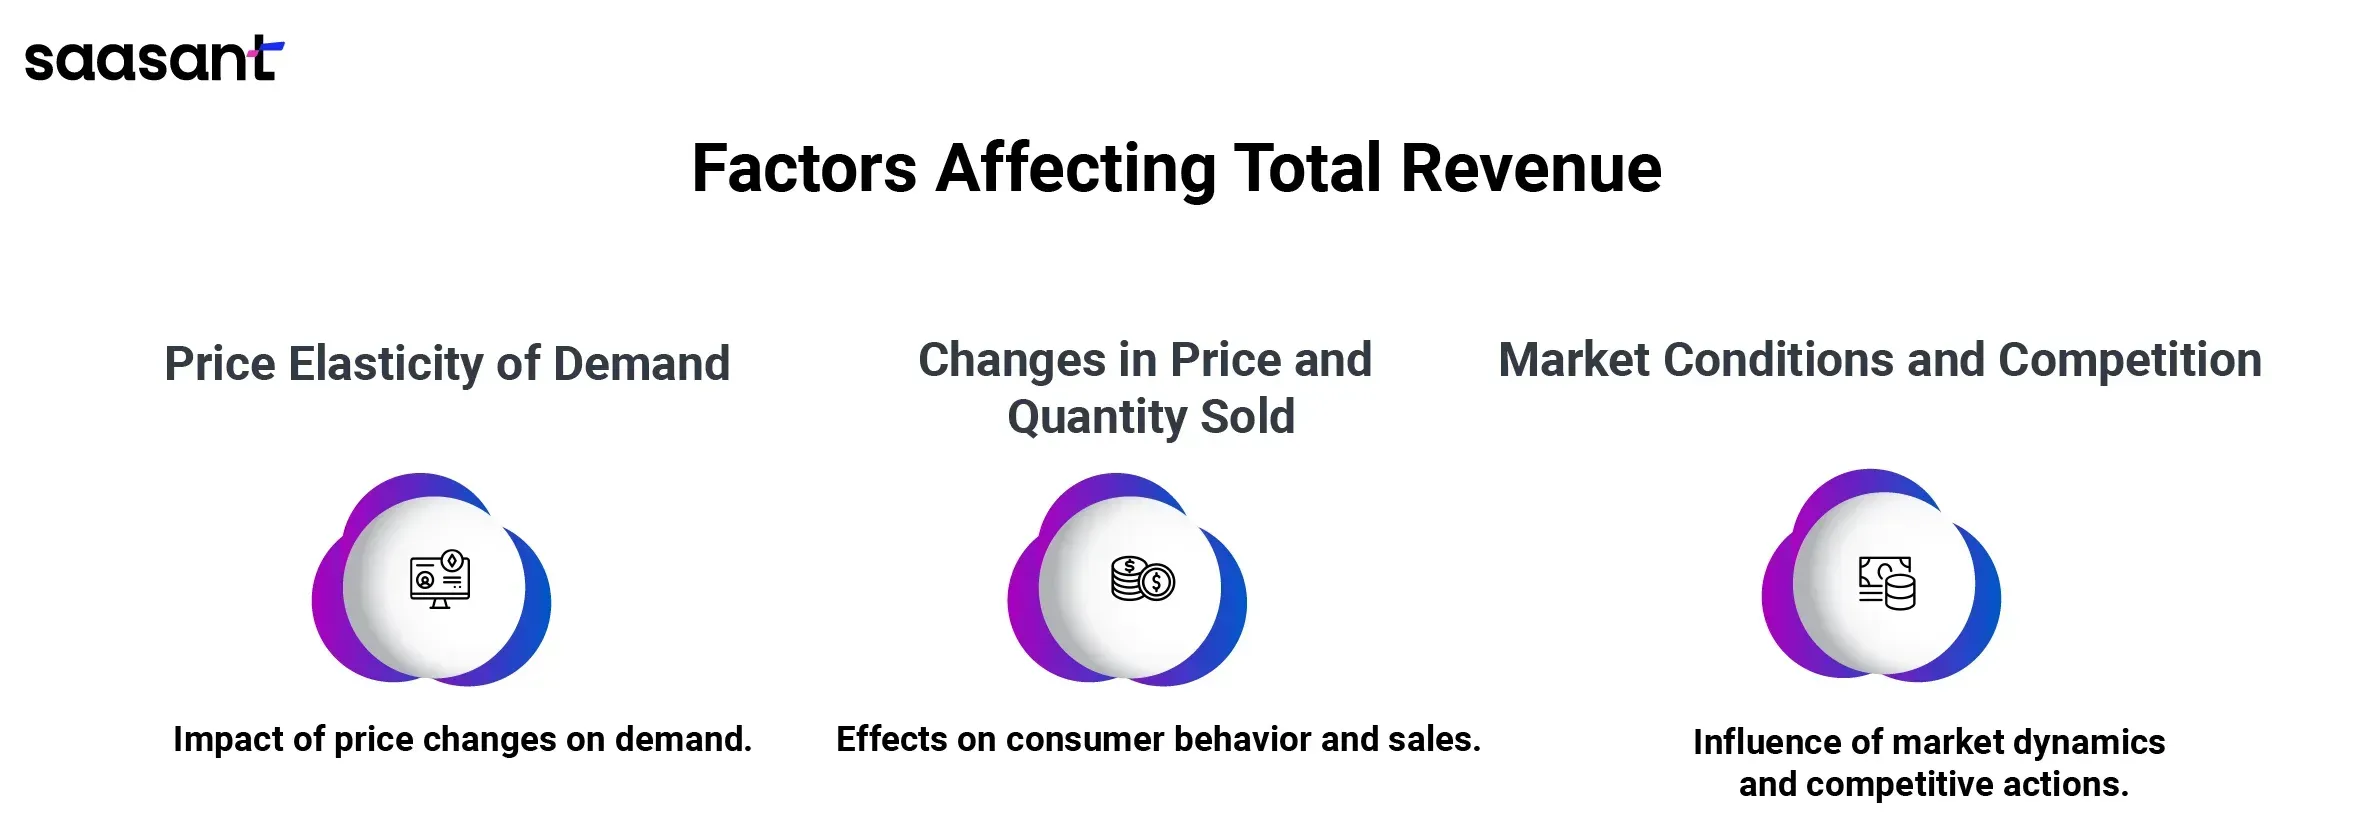
Price elasticity of demand plays a pivotal role in determining how price changes affect the quantity demanded of a product or service. Several factors contribute to elastic demand, where small changes in price lead to proportionally more significant changes in quantity demanded. These factors include consumer preferences, availability of substitutes, and the necessity of the product or service.
Price sensitivity, or the degree to which consumers respond to changes in price, is a critical aspect of demand elasticity. High price sensitivity indicates that consumers are more responsive to price changes, leading to more significant fluctuations in quantity demanded in response to price adjustments.
Understanding demand elasticity is crucial for businesses when setting pricing strategies. An elasticity of demand analysis helps companies anticipate how price changes impact total revenue. Businesses can optimize revenue generation and enhance profitability by aligning pricing strategies with demand elasticity.
Changes in Price and Quantity Sold:
Changes in price and quantity sold directly influence total revenue. Price fluctuations can significantly impact consumer purchasing behavior and overall sales performance. When prices increase, consumers may decrease the quantity demanded, decreasing total revenue, especially in elastic markets. Conversely, price reductions may stimulate demand and result in increase revenue, particularly in inelastic markets.
Similarly, variations in quantity sold can affect total revenue. Changes in consumer preferences, market trends, or external factors can lead to fluctuations in the quantity demanded of a product or service. Businesses must closely monitor changes in quantity sold and adjust pricing strategies accordingly to maximize revenue.
The relationship between price and quantity sold is crucial for revenue optimization. Analyzing the price effect on revenue and understanding the correlation between the amount sold and revenue enables businesses to make data-driven decisions to enhance revenue performance.
Market Conditions and Competition:
Market conditions and competitive landscapes significantly influence total revenue. Dynamic market environments, characterized by shifting consumer preferences, economic conditions, and technological advancements, impact consumer behavior and purchasing decisions.
In highly competitive markets, businesses face pressure to differentiate themselves and offer compelling value propositions to attract customers. Competitive pricing effects, such as price wars or strategies adopted by competitors, can influence consumer perceptions and total revenue.
Understanding market dynamics and competition is essential for developing effective revenue strategies. Analyzing market conditions, assessing competitive positioning, and implementing revenue optimization tactics enable businesses to adapt to changing market dynamics and maintain a competitive edge.
Factors such as price elasticity of demand, price and quantity sold changes, and market conditions and competition significantly influence total revenue. By understanding these factors and their implications, businesses can develop robust revenue strategies, maximize revenue generation, and achieve long-term success in today's dynamic business environment.
Common Mistakes to Avoid
Avoiding common mistakes is crucial for maintaining success and driving the growth of any business. Here are three key pitfalls to steer clear of:
Misinterpretation of Total Revenue:
Misinterpreting total revenue figures can lead to misguided decisions and missed opportunities. Total revenue represents the overall income a business generates from its core operations, encompassing all sources of income. However, misinterpreting total revenue may occur for various reasons, such as incorrect calculations, overlooking specific revenue streams, or misreading financial statements.
Common mistakes to avoid include misunderstanding revenue calculations, misinterpreting revenue data, and confusing total revenue with other financial metrics. For instance, total revenue misunderstanding may occur when revenue from different sources is not correctly aggregated or when non-operational income is mistakenly included in total revenue calculations.
To avoid misinterpretation of total revenue, businesses should ensure accurate data collection and analysis, employ proper accounting practices, and seek professional guidance when necessary. By understanding the nuances of total revenue calculation and interpreting revenue figures accurately, businesses can make informed decisions and drive sustainable growth.
Confusion with Total Sales and Total Profit:
Confusing total sales with total revenue or profit is a common mistake that can lead to financial mismanagement and inaccurate performance evaluation. While total sales represent the total value of goods or services sold, total revenue encompasses all sources of income generated by a business. Similarly, total profit reflects the gross revenue, and net revenue after deducting all expenses from total revenue.
Misunderstanding the distinction between total sales, revenue, and profit can result in incorrect financial analysis and decision-making. For example, mistaking total sales for total revenue may lead to overestimating revenue and underestimating expenses, resulting in inaccurate profitability assessments.
To avoid confusion between total sales, revenue, and profit, businesses should maintain clear and accurate financial records, conduct regular financial audits, and educate stakeholders on the differences between these financial metrics. Companies can make informed financial decisions and optimize their economic performance by understanding the relationship between sales, revenue, and profit.
Overlooking Market Dynamics:
Neglecting market dynamics can hinder business growth and competitiveness. Market dynamics encompass consumer behavior, industry trends, competitor actions, and economic conditions that influence the demand for products or services.
Avoiding common mistakes includes ignoring market influences, overlooking market trends, and underestimating the impact of market dynamics on business operations. For example, failing to adapt to changing consumer preferences or industry trends may result in loss of market share and revenue decline.
To avoid overlooking market dynamics, businesses should conduct thorough market research, monitor industry trends, and stay abreast of competitor activities. Companies can identify growth opportunities, mitigate risks, and maintain a competitive edge by understanding market dynamics and responding proactively to market changes.
It is essential for business success to avoid common mistakes such as misinterpreting total revenue, confusing total sales and total profit, and overlooking market dynamics. By staying vigilant, employing best practices, and seeking professional guidance, businesses can mitigate risks, capitalize on opportunities, and achieve long-term growth and profitability.
Advanced Considerations and Analysis in Business
Advanced considerations and analysis are pivotal in driving strategic decision-making and achieving sustainable growth in the complex business operations landscape. Let's explore three key areas of advanced study and considerations:
Total Revenue and Marginal Revenue:
Total revenue, the aggregate income generated from sales or operations, and marginal revenue, the additional revenue generated from selling one more unit of a product or service, are essential concepts in business analysis.
Advanced analysis involves comparing total and marginal revenue to gain insights into revenue trends and pricing strategies. Businesses can identify revenue optimization and growth opportunities by conducting a thorough analysis.
Total revenue measurement provides a holistic view of income generation, while marginal revenue calculation helps businesses understand the incremental impact of sales volume changes on revenue. Marginal revenue assessment is crucial for pricing decisions and revenue optimization strategies.
Optimizing revenue management practices and leveraging marginal revenue calculations can help businesses fine-tune pricing strategies, maximize revenue generation, and enhance profitability.
Total Revenue and Total Cost:
Understanding the relationship between total revenue and cost is essential for assessing profitability and making informed financial decisions.
Advanced analysis involves conducting a comprehensive revenue-cost analysis to evaluate the financial performance of business operations. Businesses can determine their profitability and cost-effectiveness by comparing total revenue and cost.
Revenue-cost optimization strategies balance revenue generation and cost management. By optimizing revenue-cost management practices, businesses can maximize profitability and efficiency.
Cost-revenue implications are critical in business decision-making, impacting overall financial health and long-term sustainability. Cost-effectiveness evaluation helps businesses identify opportunities for cost reduction and efficiency improvement.
Businesses can achieve profitability and long-term success by conducting advanced revenue-cost analysis and implementing cost-revenue optimization strategies.
Total Revenue and Profit Maximization:
Profit maximization is crucial for businesses seeking financial success and sustainable growth.
Advanced analysis involves optimizing revenue-profit relationships and implementing profit maximization strategies. Businesses can maximize profitability and shareholder value by aligning revenue generation with profit objectives.
Revenue-driven profit strategies focus on maximizing revenue while maintaining profitability. By leveraging revenue-profit optimization techniques, businesses can identify opportunities for revenue generation and cost reduction.
Maximizing revenue for profit requires a comprehensive understanding of revenue-profit correlations and market dynamics. Businesses can achieve sustainable growth and competitive advantage by aligning revenue and profit objectives.
Businesses can optimize financial performance and achieve long-term success by conducting advanced revenue-profit analysis and implementing profit maximization techniques.
Advanced considerations and analysis in areas such as total revenue and marginal revenue, total revenue and total cost, and total revenue and profit maximization are essential for driving strategic decision-making and achieving sustainable growth in today's competitive business environment.
Tools and Resources for Total Revenue Analysis
In today's data-driven business landscape, accurate and insightful revenue analysis is essential for making informed decisions and driving growth. Fortunately, many tools and resources are available to aid in total revenue analysis. Let's explore three critical categories of these tools:
Spreadsheet Software:
Spreadsheet software such as Microsoft Excel is one of the most versatile and widely used tools for total revenue analysis. With its user-friendly interface and powerful features, Excel allows businesses to perform various revenue analysis tasks.
Businesses can leverage Excel for various revenue analysis purposes, including tracking sales data, calculating total revenue, and creating financial models. Excel's built-in functions and formulas enable users to perform complex calculations quickly and generate insightful reports rapidly.
From basic revenue calculations to advanced financial analysis, Excel provides a comprehensive platform for businesses to analyze their total revenue effectively. Additionally, companies can customize Excel spreadsheets to suit their specific revenue analysis needs, making it a highly flexible tool.
Statistical Software:
Statistical software offers advanced capabilities for total revenue analysis, allowing businesses to conduct in-depth statistical analysis and forecast revenue trends precisely. Popular statistical software packages such as SPSS, SAS, and R provide powerful tools for analyzing revenue data and uncovering insights.
These tools enable businesses to apply statistical methods and techniques to revenue analysis, including regression analysis, time series analysis, and forecasting models. By leveraging statistical software, companies can identify patterns, trends, and relationships within their revenue data, empowering them to make data-driven decisions.
Statistical software also offers advanced visualization capabilities, allowing businesses to create informative charts, graphs, and dashboards to present revenue analysis results effectively. With its robust features and advanced analytics capabilities, statistical software is a valuable resource for businesses seeking more profound insights into their total revenue.
Online Calculators and Templates:
Online calculators and templates provide convenient and accessible tools for total revenue analysis, offering pre-built solutions for everyday revenue analysis tasks. These tools are handy for businesses needing access to specialized software or expertise in revenue analysis.
Revenue analysis calculators allow businesses to quickly perform basic revenue calculations, such as total revenue, average revenue per customer, and revenue growth rate. Online templates provide customizable frameworks for organizing and analyzing revenue data, streamlining the analysis process.
Additionally, online tools offer the convenience of access at any time and anywhere, making them ideal for businesses with remote teams or decentralized operations. By leveraging online calculators and templates, companies can simplify and expedite their total revenue analysis efforts, enabling them to make timely and informed decisions.
Spreadsheet software, statistical software, and online calculators and templates are valuable tools and resources for total revenue analysis. By effectively leveraging these tools, businesses can gain deeper insights into their revenue performance, identify growth opportunities, and drive success in today's competitive business environment.
Conclusion
Calculating total revenue regularly is crucial for business growth and success. It provides essential insights into a company's financial health, performance, and growth potential, enabling businesses to make informed decisions and stay competitive.
Key Insights:
Monitoring Financial Health: Consistently tracking total revenue helps businesses identify income trends, assess revenue strategies, and detect fluctuations early, allowing for proactive adjustments.
Empowering Decision-Making: Total revenue analysis offers a deep understanding of revenue streams, customer behavior, and market dynamics, guiding decisions in product development, marketing, resource allocation, and financial planning.
Additional Considerations:
Marginal Revenue: Analyzing total revenue alongside marginal revenue reveals the additional income from selling one more unit of a product or service.
Sales Revenue Formula: Accurately calculating total revenue involves multiplying the number of units sold by the average sales price, an essential part of the income statement.
Deferred Revenue: Recognizing deferred revenue is vital for understanding future income from services or products to be delivered.
Revenue vs. Net Revenue: Differentiating between gross and net income is crucial for accurate financial statements and health assessments.
By embracing total revenue analysis, businesses can increase revenue, boost sales, and ensure long-term financial health and prosperity.
If you want to learn more about finding marginal cost, check out this guide how to find marginal cost.
FAQs
What is total revenue, and why is it essential for businesses?
Total revenue represents the sum of all income a business generates from its various revenue streams. Financial analysis, strategic planning, and optimizing operations are crucial for sustainable growth and profitability.
How do you calculate total revenue for a business?
Total revenue is calculated by multiplying the unit price of a product or service by the quantity sold within a specific period. The formula to find total revenue is Total Revenue = Unit Price * Quantity Sold.
Why is understanding total revenue significant for financial analysis?
Total revenue is crucial for evaluating a company's financial performance and profitability. It provides insights into revenue-generating capabilities, growth trends, and the effectiveness of marketing and operational strategies.
What are the components of total revenue calculation?
The components include determining the unit price of the product or service, quantifying the quantity sold, and multiplying the unit price by the quantity sold to arrive at the total revenue figure.
How does total revenue relate to the price elasticity of demand?
Total revenue and price elasticity of demand have an inverse relationship. In elastic markets, price changes lead to significant changes in quantity demanded, affecting total revenue differently than inelastic markets.
What mistakes should businesses avoid when calculating total revenue?
Businesses should be aware of total revenue figures, distinguish total sales from total revenue or profit, and overlook market dynamics influencing revenue generation.
What tools and resources are available for total revenue analysis?
Tools such as spreadsheet software (e.g., Excel), statistical software (e.g., SPSS, SAS), and online calculators and templates provide valuable resources for businesses to analyze their total revenue effectively.