Balance Sheet vs Income Statement: Key Differences Explained
 Balance sheets and income statements go hand in hand in analyzing a business’s financial health. While the income statement reveals a company's profitability over a specific period, The balance sheet provides a static picture of a company's financial standing at a particular time. Understanding their differences is vital for investors, creditors, and business owners. This blog will explore how these two fundamental financial statements complement each other, providing insights into a company's performance, solvency, and overall financial well-being.
Key Takeaways
Distinct Purposes: The balance sheet shows financial health at a point in time; the income statement shows profitability over time.
Time Frame: The balance sheet is static, whereas the income statement is dynamic.
Structure: The balance sheet details assets, liabilities, and equity; the income statement outlines revenue, expenses, and net income.
Financial Analysis: The balance sheet aids liquidity and solvency assessment; the income statement helps evaluate profitability and efficiency.
Contents
What is a Balance Sheet?
What is an Income Statement?
Balance Sheet vs Income Statement: Key Differences
Importance of Both Statements in Financial Reporting
Accounting Software for Balance Sheet and Income Statement
How to Read a Balance Sheet: Step-by-Step Guide
How to Read an Income Statement
Practical Examples
Common Mistakes to Avoid
Conclusion
FAQ
What is a Balance Sheet?
A balance sheet is a financial statement that provides an overview of a company’s financial health at a specific time. It outlines what a company owns (assets), owes (liabilities), and the value of ownership (shareholders’ equity).
Assets: These are resources owned by a company that have value and can be converted into cash. Examples include cash, inventory, property, and equipment.
Liabilities: These are financial obligations or debts that a company owes to others. They can be short-term (payable within a year) or long-term. Examples include loans, accrued expenses, and accounts payable.
Shareholders’ Equity: This represents the residual value of a company’s assets after deducting its liabilities. It reflects the amount invested by shareholders in the business.
What is an Income Statement?
An income statement, also known as a profit and loss (P&L) statement, summarizes a company's revenues, costs, and expenses during a specific period and reveals its profitability.
Revenue: This is the income generated from a company's primary operations, such as sales of goods or services.
Expenses: These are a company's operating expenses. They include things like salaries, rent, utilities, and advertising.
Net Income: It is the final profit figure after all business expenses are deducted from revenue, indicating the company's financial health.
Balance Sheet vs Income Statement: Key Differences
Here are the key differences between the balance sheet and income statement.
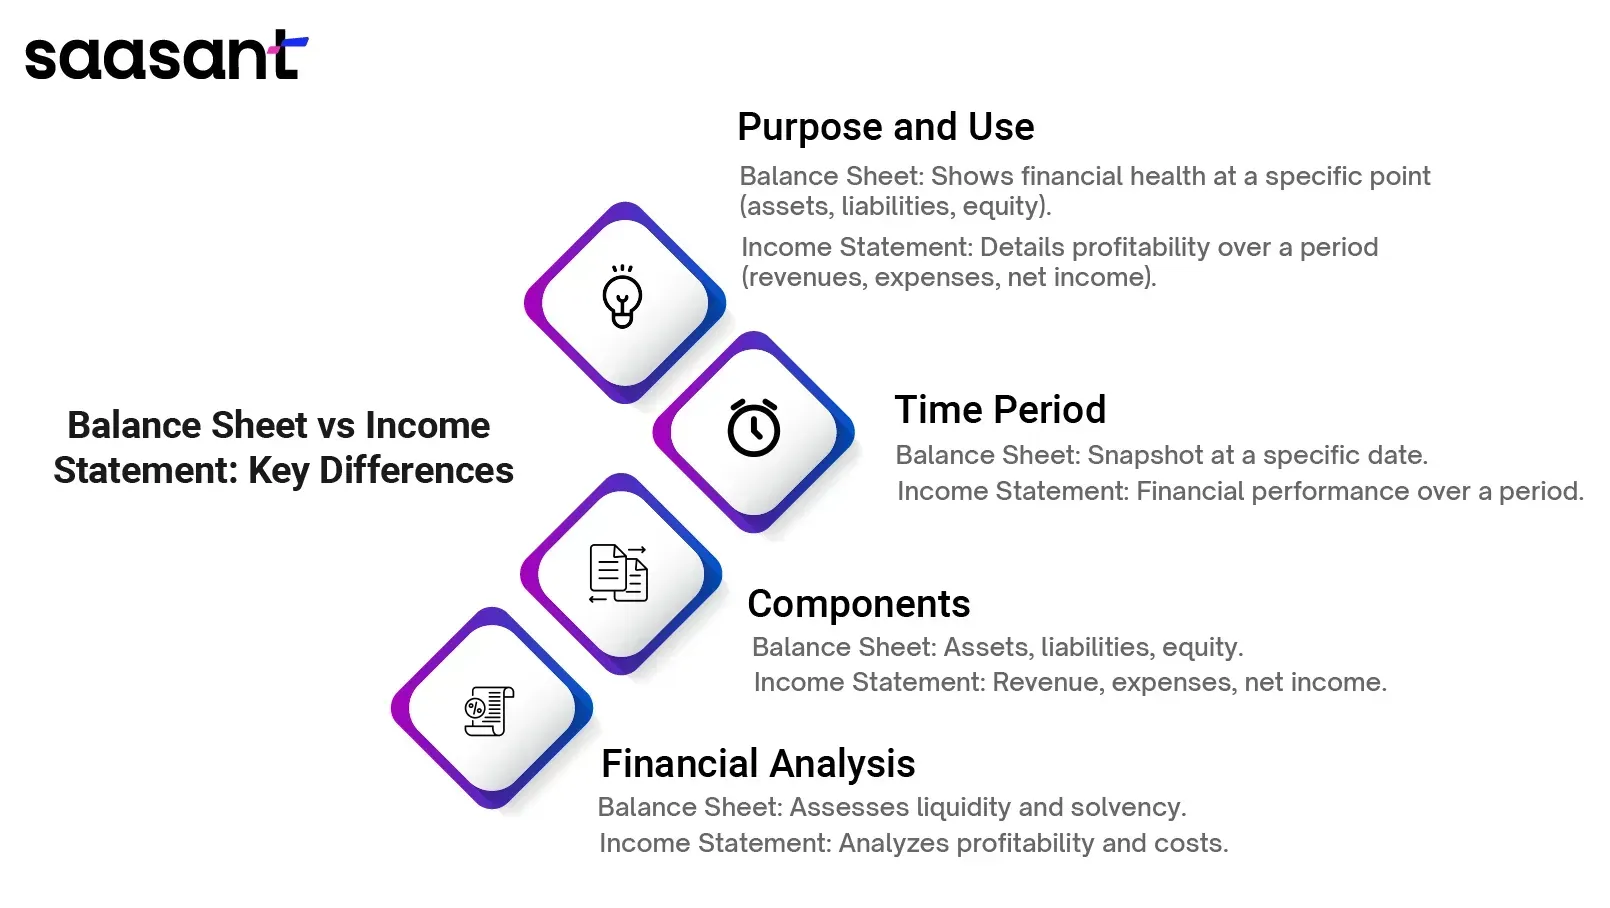
Purpose and Use
The balance sheet and income statement serve distinct purposes. A balance sheet offers an overview of a company's financial health at a specific time, revealing assets, liabilities, and shareholders' equity. This helps assess solvency, liquidity, and financial structure. In contrast, the income statement (profit or loss statement) focuses on profitability over a period, detailing revenues, expenses, and net income. It provides insights into operational performance and efficiency.
Time Covered
A key difference lies in the time frame each statement covers. The balance sheet presents a static view of a company's finances at a particular date. Conversely, the income statement offers a dynamic view of financial performance over a specific period, such as a quarter or year.
Components and Structure
The balance sheet is divided into assets, liabilities, and shareholders' equity. Assets are listed in order of liquidity, while liabilities are categorized as short-term and long-term. The income statement is typically organized in a multi-step format, starting with revenue and subtracting expenses to arrive at net income.
Impact on Financial Analysis
Both statements are crucial for financial analysis. The balance sheet calculates ratios to assess liquidity, solvency, and efficiency. The income statement is essential for profitability analysis, identifying cost trends, and evaluating operational efficiency. By combining insights from both, analysts can construct a comprehensive picture of a company's financial performance and position.
Importance of Both Statements in Financial Reporting
You can’t fully understand a company’s financial health by looking at just one side of the coin.
While the income statement shows how profitable your business was over a period, the balance sheet presents a fixed picture of your financial status at a specific moment. They offer a comprehensive view of your company’s financial performance and stability. Think of it as looking at a company’s past performance (income statement) and current financial standing (balance sheet) to predict its future.
Accounting Software for Balance Sheet and Income Statement
QuickBooks and Xero are popular accounting software for generating accurate balance sheets and income statements. These platforms simplify financial management by automating calculations and providing real-time insights. Saasant Transactions, a bulk data upload tool, further enhances this process by automating financial data upload into QuickBooks or Xero, saving time and reducing errors. You can upload XlS, XLSX, CSV, IIF, and even convert PDF into the required format. This consolidated approach empowers businesses to make data-driven decisions with confidence. The best part is that SaasAnt Transactions comes with a 30-day free trial.
How to Read a Balance Sheet: Step-by-Step Guide
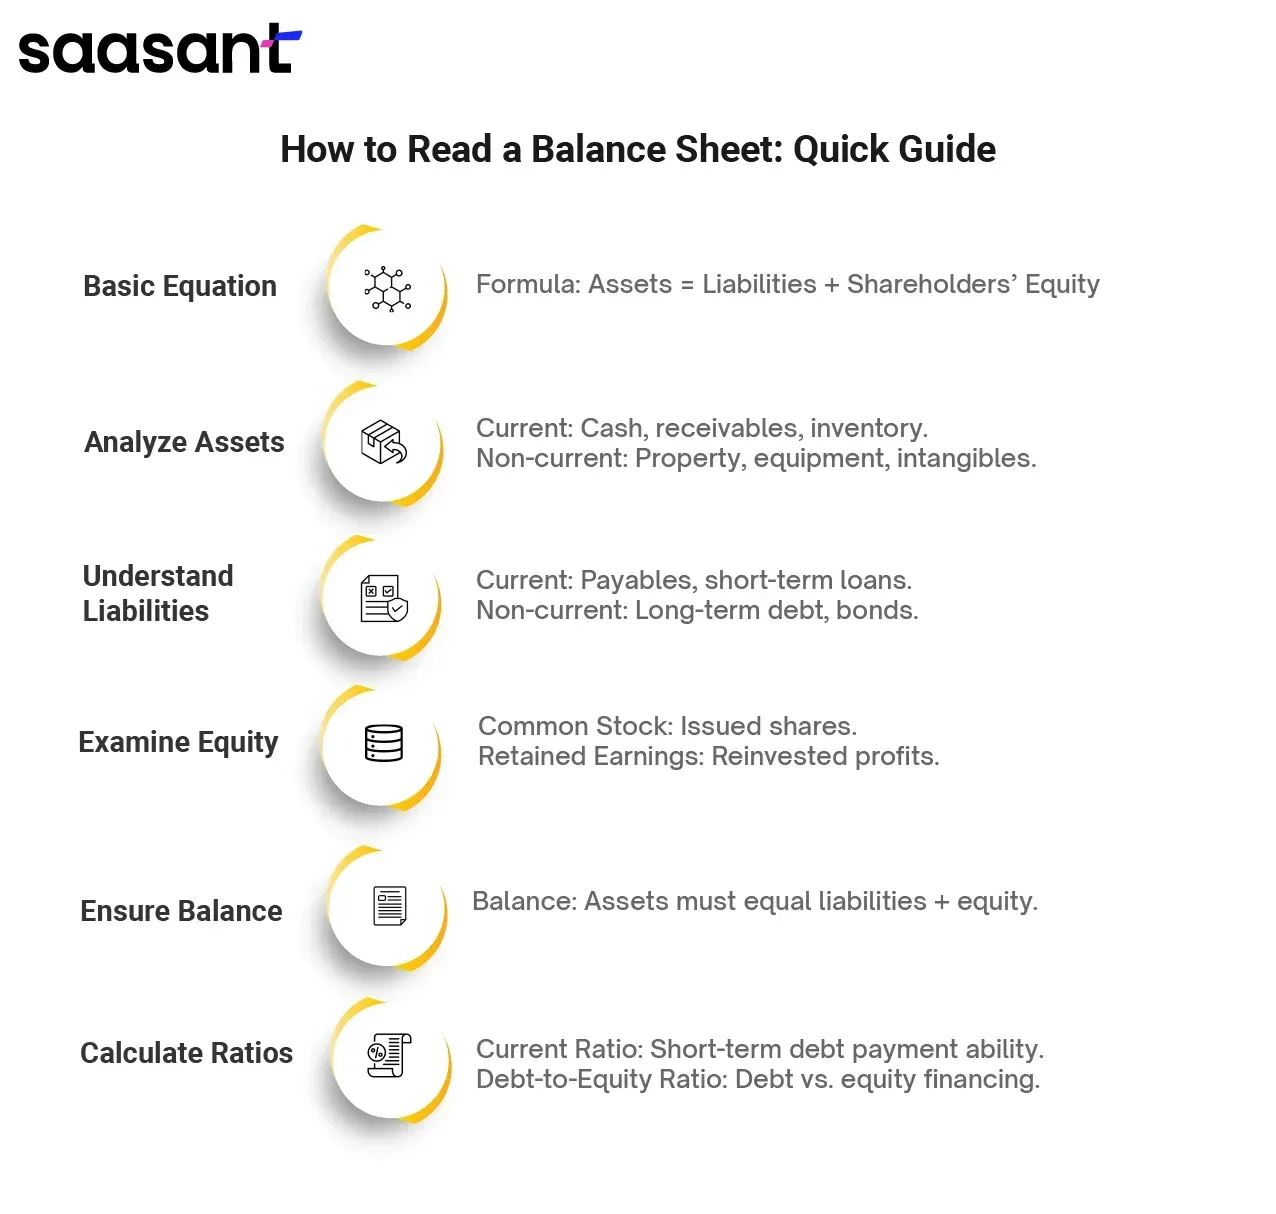
Step 1: Understand the Basic Equation
Assets = Liabilities + Shareholders’ Equity. This means a company's resources (assets) are financed by what it owes (liabilities) and what its owners have invested (shareholders’ equity).
Step 2: Analyze Assets
Current Assets: Assets readily convertable into cash within a year. Examples include cash, accounts receivable, and inventory.
Non-current Assets: These assets have a lifespan of more than a year. Examples include property, plant, equipment, and intangible assets (like patents or goodwill).
Step 3: Understand Liabilities
Liabilities: Debts or short-term financial obligations due within a year. Examples include accounts payable, short-term loans, and accrued expenses.
Non-current Liabilities: These are long-term debts due beyond a year. Examples include long-term loans, bonds payable, and deferred taxes.
Step 4: Examine Shareholders’ Equity
This represents the value remaining after a company's debts are paid off from its assets. It includes:
Common Stock: The value of shares issued by the company.
Retained Earnings: The accumulated profits reinvested in the business.
Step 5: Check for Balance
The total of assets must always equal the total of liabilities plus shareholders’ equity. This ensures the balance sheet is accurate.
Step 6: Calculate Ratios
While not part of the balance sheet, you can calculate ratios to assess a company's financial health. Common ratios include:
Current Ratio: Measures a company's ability to pay short-term debts.
Debt-to-Equity Ratio: Measures the proportion of a company's financing from debt compared to shareholder equity.
How to Read an Income Statement
An income or profit and loss statement reveals a company’s profitability over a specific period. Let’s break down how to understand it:
Understand the Basic Structure
The income statement typically follows a top-down format:
Revenue: The total income generated from the company’s core operations.
Cost of Goods Sold (COGS): These are the direct costs of producing or acquiring products sold.
Gross Profit: This is the revenue minus the COGS.
Operating Expenses: These are costs related to running the business, such as salaries, rent, utilities, and marketing.
Operating Income: This is the gross profit minus operating expenses.
Other Income/Expenses: These are gains or losses from non-core activities.
Net Income: This is the final profit after accounting for all revenues, costs, and expenses.
Analyze Key Components
Revenue: Look for trends in revenue growth. Are sales increasing or decreasing?
Gross Profit Margin: This ratio measures the profitability of each sales dollar. A higher margin is generally better.
Operating Expenses: Identify significant expense categories and compare them to previous periods. Are there any unusual expenses?
Net Income: This is the bottom line, indicating overall profitability.
Compared to Previous Periods
Analyze trends over time to identify revenue, expenses, and profitability patterns. Are there any significant changes or anomalies?
Practical Examples
Example of a Balance Sheet
Let's consider a hypothetical small retail business called "Tech Gadgets" as of December 31, 2023:
Tech Gadgets Balance SheetAs of December 31, 2023
Assets
Cash: $50,000
Accounts Receivable: $20,000
Inventory: $100,000
Equipment: $150,000
Total Assets: $320,000
Liabilities
Accounts Payable: $30,000
Loans Payable: $80,000
Total Liabilities: $110,000
Shareholders' Equity
Common Stock: $100,000
Retained Earnings: $110,000
Total Shareholders' Equity: $210,000
Total Liabilities and Shareholders' Equity: $320,000
Explanation: Tech Gadgets has $50,000 in cash, $20,000 owed by customers (accounts receivable), $100,000 worth of products on hand (inventory), and $150,000 worth of equipment. It owes $30,000 to suppliers (accounts payable) and $80,000 in loans. The owners have invested $100,000 in the company (common stock), and the company has retained $110,000 in earnings. As you can see, the total assets equal the total liabilities plus shareholders' equity.
Example of an Income Statement
Let's look at Tech Gadgets' income statement for the year ended December 31, 2023:
Tech Gadgets Income Statement For the Year Ended December 31, 2023
Revenue: $400,000
Cost of Goods Sold: $250,000
Gross Profit: $150,000
Operating Expenses: $80,000
Operating Income: $70,000
Net Income: $50,000
Explanation: Tech Gadgets generated $400,000 in sales. The cost to produce and sell those products was $250,000, resulting in a gross profit of $150,000. Operating expenses, such as salaries, rent, and utilities, totaled $80,000. This left an operating income of $70,000. After considering other income and costs (not shown in this example), the company had a net income of $50,000 for the year.
Common Mistakes to Avoid
Mistakes in Interpreting a Balance Sheet
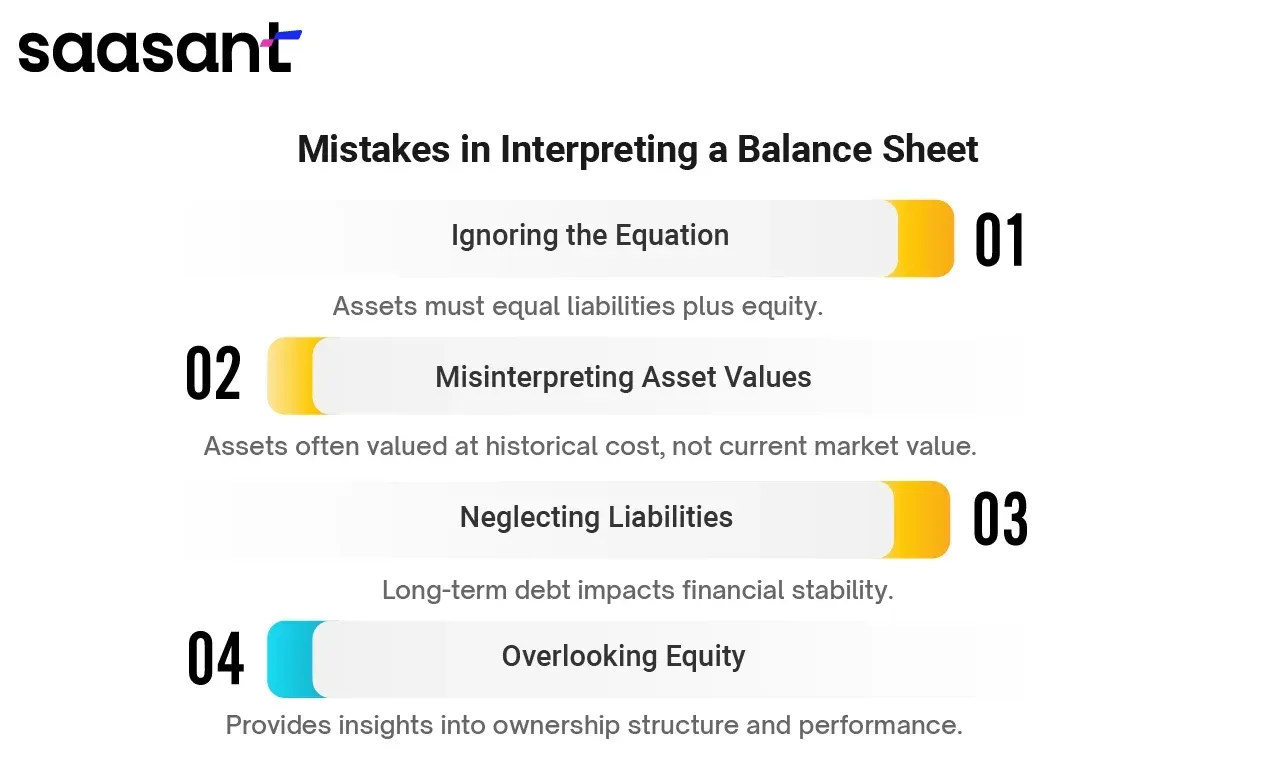
Ignoring the Balance Sheet Equation: One common mistake is forgetting that assets must equal liabilities plus shareholders' equity. This fundamental equation ensures the balance sheet is accurate.
Misinterpreting Asset Values: Assets are often valued at historical cost, which might not reflect their current market value. Overlooking this can lead to an inaccurate assessment of a company's financial health.
Neglecting Liabilities: Focusing solely on assets can be misleading. Liabilities, especially long-term debt, significantly impact a company's financial stability.
Overlooking Shareholders' Equity: This component provides valuable insights into a company's ownership structure and financial performance. Ignoring it can lead to incomplete analysis.
Mistakes in Interpreting an Income Statement
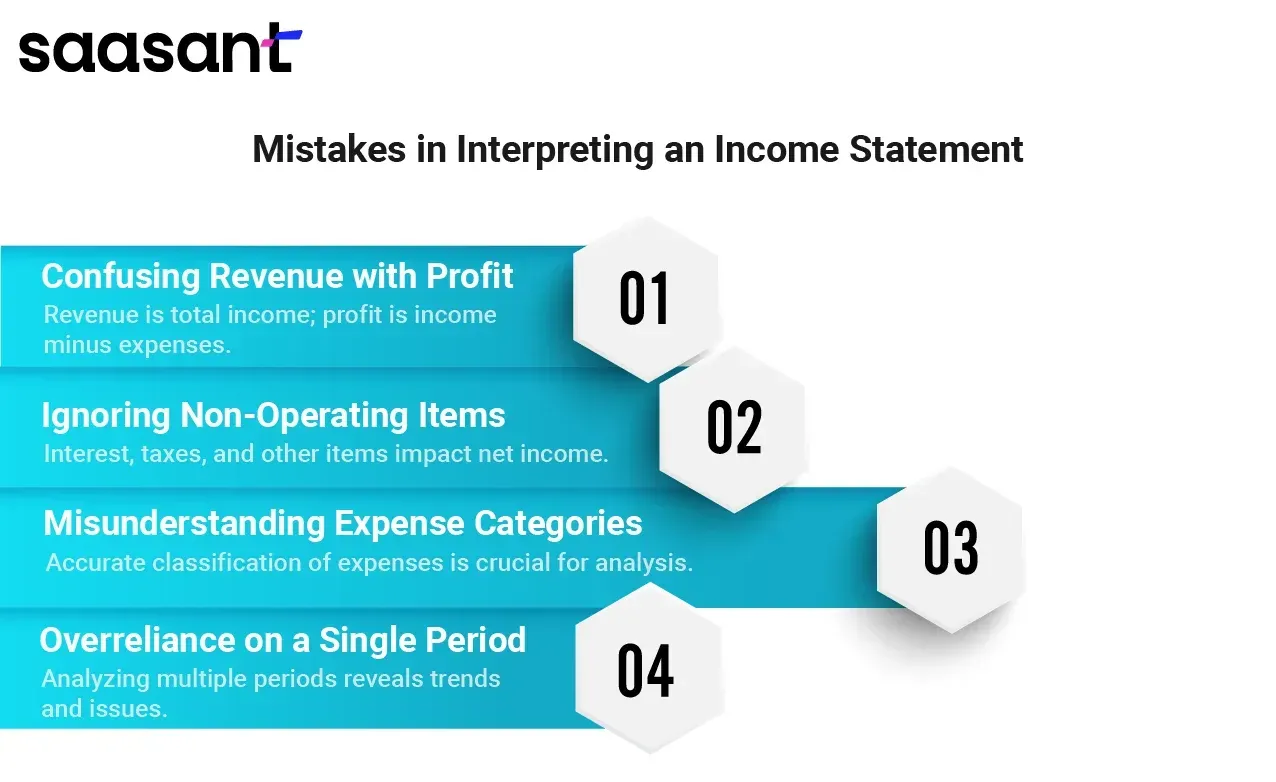
Confusing Revenue with Profit: Revenue is the total income, while profit is the amount left after deducting expenses. Focusing solely on revenue without considering costs can be misleading.
Ignoring Non-Operating Items: Interest income, interest expense, and taxes can significantly impact net income and distort the overall profitability picture.
Misunderstanding Expense Categories: Accurately classifying expenses is crucial. Miscategorizing expenses can affect profitability and other financial ratios.
Overreliance on a Single Period: Analyzing only one period's income statement might not reveal trends or underlying issues. Comparing results over time is essential.
Conclusion
Understanding both the balance sheet and income statement is essential for your business success. The balance sheet gives you an overview of your company's financial health at a specific time, detailing what you own and owe. In contrast, the income statement reveals your profitability over time, showing your revenues and expenses. These statements provide a complete picture of your financial performance and position. Using both, you can make informed decisions, ensure financial stability, and strategize for future growth. Leverage applications like SaasAnt Transactions to maintain data integrity, reduce errors, and save time. Remember these insights; you'll be well-equipped to navigate your business's financial landscape effectively.
FAQ
What is the difference between a balance sheet and an income statement?
A balance sheet provides an overview of a company's financial position at a specific time, showing assets, liabilities, and shareholders' equity. An income statement summarizes a company's revenues, expenses, and net income over a particular period, indicating profitability.
What comes first balance sheet or income statement?
Typically, the income statement is prepared first. This is because net income from the income statement is needed to calculate the retained earnings on the balance sheet, completing the equity section.
Is there a relationship between an income statement and the balance sheet?
Yes, there is a relationship. The net income from the income statement affects the shareholders' equity on the balance sheet. Additionally, elements like depreciation and accounts receivable/payable connect both statements.
Why is the balance sheet crucial?
The balance sheet is crucial because it shows the company's financial position at a specific time. It provides a detailed look at what the company owns and owes, helping stakeholders assess liquidity, solvency, and overall financial health.
Why is the income statement important?
The income statement is crucial because it reveals a company's profitability over time, showing how revenue transforms into net income. It helps stakeholders evaluate operational performance and efficiency, guiding business decisions.